Download
1 / 18
180 likes | 184 Vues
Remotely Sensed Data. EMP 580 Fall 2015 Dr. Jim Graham Materials from Sara Hanna. Remotely Sensed Data. Remotely Sensed data is: Acquired remotely from the observer This makes it different from field surveys Acquired by: Satellites Airplanes UAVs/UAS/Drones Automated Stations?.

E N D
Remotely Sensed Data EMP 580 Fall 2015 Dr. Jim Graham Materials from Sara Hanna
Remotely Sensed Data • Remotely Sensed data is: • Acquired remotely from the observer • This makes it different from field surveys • Acquired by: • Satellites • Airplanes • UAVs/UAS/Drones • Automated Stations?
Active vs. Passive • “Sensors” can be active or passive • Active sensors send out a signal and measure the returned signal: • LiDAR • Radar • Passive sensors measure energy emitted by another source, usually the sun • Most of the data we use (except DEMs) are from passive sensors so we’ll be talking about them from now on • For more information, see GSP 216
Landsat 8 – King Fire True Color
Landsat 8 - King Fire False Color (Red – Shortwave Infrared, Green – NIR, Blue – Visible)
Landsat 8 - King Fire False Color (Red – Shortwave Infrared, Green – Shortwave Infrared, Blue – NIR)
Landsat Orbit http://www.youtube.com/watch?v=P-lbujsVa2M
Landsat The Landsat satellites have carried six different sensor types • Return Beam Vidicon (RBV) • Multispectral Scanner (MSS) • Thematic Mapper (TM) • Enhanced Thematic Mapper (ETM) • Enhanced Thematic Mapper Plus (ETM+) • Operational Land Imager (OLI) and Thermal Infrared Sensor (TIRS)
Where to obtain data? • USGS EarthExplorer • http://earthexplorer.usgs.gov/ • USGS Global Visualization Viewer - GLOVIS • http://glovis.usgs.gov/ • USDA Geospatial Data Gateway • http://datagateway.nrcs.usda.gov/
What data products are available? • Landsat Archive • MODIS • Aerial photos • Historical • NHAP/NAAP/NAIP • Digital Elevation Models • Climate Data • Watershed • Land Use/ Land Cover • Soils
File Sizes • MODIS Image -11,127,225 pixels (7 bands, 500m resolution) • Landsat Panchromatic- 234,404,221 pixels (1 band,15 m resolution) • Landsat Multispectral - 58,532,901 pixels (7 bands, 30m resolution) • NAIP Image - 261,532,200 pixels (4 bands, 1 m resolution)
What format ? • Most data is downloaded in a compressed format • Large file sizes • Level 1 Data • Corrected for radiometric and geometric accuracy • GeoTIFF data format • Separate file for each band
Commercial • SPOT – 1986-2014 (1.5 – 20m) • IKONOS – 1999 (1 -4 m) • Quickbird – 2001 (0.60 - 2.4 m) • World-View-2 – 2009 (0.46 – 1.84m) • WorldView-3 – 2014 (0.31 – 3.7 m) • Disaster Monitoring Constellation (DMC) 2002-Present • Five satellites, 30-40 m in 3-4 bands
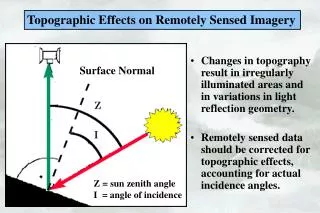
Electromagnetic Radiation • Most remotely sensed data is derived from Electromagnetic Radiation (EMR). This includes: • Visible light • Infrared light (heat) • X-Rays • Radar • Etc. • To use RS data we need to review some information on EM