Download
1 / 33
340 likes | 953 Vues
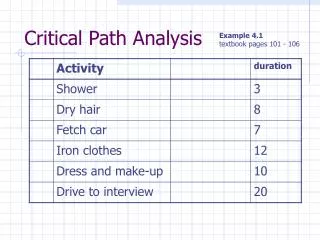
Project Management Finding the Critical Path. Introduction. Project management can be used to manage complex projects. The first step in planning and scheduling a project is to develop the work breakdown structure.

E N D
Project Management Finding the Critical Path
Introduction • Project management can be used to manage complex projects. • The first step in planning and scheduling a project is to develop the work breakdown structure. • This involves identifying the activities that must be performed in the project. Each detail and each activity may be broken into its most basic components. • The time, cost, resource requirements, predecessors, and person(s) responsible are identified.
Project Management Definition: It is nothing more (or less) than knowing what the status of a project is: • when it should be done, • how much (and if) it has slipped from the original schedule, • what the bottlenecks are, and • what you might drop to save some time.
Project Management Models: History • One of the earliest techniques was the Gantt chart (Used by US Navy). • This type of chart shows the start and finish times of one or more activities, as shown below:
PERT and CPM • The program evaluation and review technique (PERT) and the critical path method (CPM) are two popular quantitative analysis techniques that help managers plan, schedule, monitor, and control large and complex projects. • They were developed because there was a critical need for a better way to manage.
Framework of PERT and CPM • There are six steps common to both PERT and CPM. • Define the project and all of its significant activities or tasks. • Develop the relationships among the activities. Decide which activities must precede others. • Draw the network connecting all of the activities. • Assign time and/or cost estimates to each activity. • Compute the longest time path through the network; this is called the critical path. • Use the network to help plan, schedule, monitor, and control the project.
Questions answered by PERT • When will the entire project be completed? • What are the critical activities or tasks in the project, that is, the ones that will delay the entire project if they are late? • Which are the non-critical activities, that is, the ones that can run late without delaying the entire project’s completion? • What is the probability that the project will be completed by a specific date?
Questions answered by PERT • At any particular date, is the project on schedule, behind schedule, or ahead of schedule? • On any given date, is the money spent equal to, less than, or greater than the budgeted amount? • Are there enough resources available to finish the project on time? • If the project is to be finished in a shorter amount of time, what is the best way to accomplish this at the least cost?
General Foundry: Example of PERT • Background: • General Foundry, Inc., a metal works plant has long been trying to avoid the expense of installing air pollution control equipment. • The local environmental protection group has recently given the foundry 16 weeks to install a complex air filter system on its main smokestack. • General Foundry was warned that it will be forced to close unless the device is installed in the allotted period. • They want to make ensure that installation of the filtering system progresses smoothly and on time.
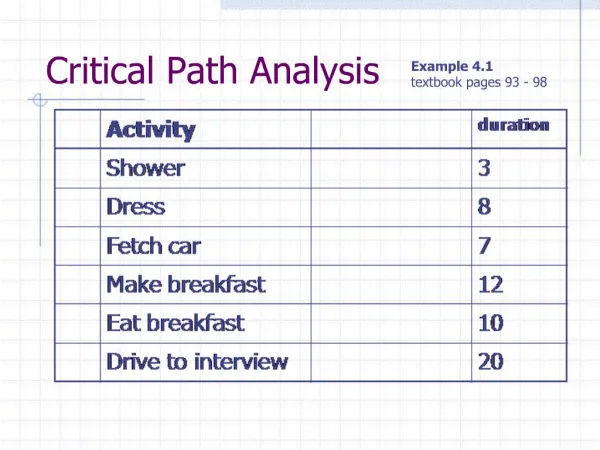
Steps One and Two: • Define the project and all project activities. • Immediate predecessors are determined in the second step.
Step Three • Activities and events are drawn and connected.
Step Four • The fourth step is to assign activity times. • Time is usually given in units of weeks. • Without solid historical data, managers are often uncertain as to activity times. • The developers of PERT thus employed a probability distribution based on three time estimates for each activity: • Optimistic time • Pessimistic time • Most likely time
Step 4 - Beta Probability • The beta probability distribution is often used when there is no solid historical data upon which to base activity time estimates • Found to be appropriate in many cases for determining an expected value and variance for activity completion times
Step Four • Three time estimates are provided for each activity: • Optimistic time (a):time an activity will take if everything goes as well as possible. There should be only a small probability (say, 1/100) of this occurring. • Pessimistic time (b):time an activity would take assuming very unfavorable conditions. There should also be only a small probability that the activity will really take this long. • Most likely time (m): most realistic time estimate to complete the activity.
Calculations with PERT • To find the expected activity time, the estimates are weighted as follows: • Variance for activity completion time is computed as
A B C D E F G H 1 2 1 2 1 1 3 1 2 3 2 4 4 2 4 2 3 4 3 6 7 9 11 3 2 3 2 4 4 3 5 2 General Foundry - Time Estimates a m b E(t) 2 Activity 25
Step Five The fifth step is to compute the longest path through the network— the critical path.
F 3 A 2 C 2 H 2 E 4 Start Finish G 5 Act. t ES EF LS LF B 3 D 3 General Foundry - PERT Network
Finding The Critical Path • To find the critical path, we need to determine the following quantities for each activity in the network: 1. Earliest start time(ES): the earliest time an activity can begin without violation of immediate predecessor requirements. 2. Earliest finish time(EF): the earliest time at which an activity can end. 3. Latest start time(LS): the latest time an activity can begin without delaying the entire project. 4. Latest finish time(LF): the latest time an activity can end without delaying the entire project.
Earliest Times – Calculations • Earliest finish time = earliest start time + t • EF = ES + t • Before any activity can begin all of its predecessor activities must be completed • ES = Largest EF of Immediate Predecessors A t=2 ES=0 EF=0+2=2 Start B t=3 ES=0 EF=0+3=3
F 3 A 2 0 2 C 2 2 H 2 E 4 Start Finish G 5 Act. t ES EF LS LF B 3 0 3 D 4 3 PERT NetworkEarliest Start & Finish
F 3 4 A 2 0 2 C 2 2 4 H 2 E 4 4 Start Finish G 5 B 3 0 3 D 4 3 7 PERT NetworkEarliest Start & Finish
F 3 4 7 A 2 0 2 C 2 2 4 H 2 13 15 E 4 4 8 Start Finish G 5 8 13 D 4 3 7 B 3 0 3 PERT NetworkEarliest Start & Finish
Latest Times – Calculations • Work backwards from the Finish • Latest start time = latest finish time – activity time • LS = LF - t • LF = Smallest LS of activities that immediately follow
F 3 4 7 13 A 2 0 2 C 2 2 4 H 2 13 15 13 15 E 4 4 8 Start Finish G 5 8 13 8 13 Act. t ES EF LS LF D 3 3 7 B 3 0 3 PERT NetworkLatest Start & Finish
F 3 4 7 10 13 A 2 0 2 0 2 C 2 2 4 2 4 H 2 13 15 13 15 E 4 4 8 4 8 Start Finish G 5 8 13 8 13 B 3 0 3 1 4 D 4 3 7 4 8 PERT NetworkLatest Start & Finish
Slack • Slack indicates how long an activity may be delayed without delaying the entire project. • LS – ES or, • LF – EF • The activities with no slack time can not be delayed without delaying the entire project • This makes them critical activities and they are said to be on the critical path
On ES EF LS LF LS-ES Activity Critical Path? A 0 2 0 2 0 Yes B 0 3 1 4 1 No C 2 4 2 4 0 Yes D 3 7 4 8 1 No E 4 8 4 8 0 Yes F 4 7 10 13 6 No G 8 13 8 13 0 Yes H 13 15 13 15 0 Yes General FoundrySchedule & Slacks
Critical Path F 3 4 7 10 13 A 2 0 2 0 2 C 2 2 4 2 4 Total Time = 15 H 2 13 15 13 15 E 4 4 8 4 8 Start Finish G 5 8 13 8 13 B 3 0 3 1 4 D 3 3 7 4 8
Project Variance • The term “project variance” refers to the critical path variance since the time to complete the project is the time to complete the critical path. • This is found by summing the variances of the activities on the critical path.
Probability Distribution for Project Completion Times Computing the standard deviation
What PERT Was Able to Provide • The project’s expected completion date is 15 weeks. • Assume that the total project completion time follows a normal probability distribution • Chart on previous slide tells us that there is a 50% chance of completing the entire project in less than 15 weeks and a 50% chance it will exceed 15 weeks • There is a 71.6% chance that the equipment will be in place within the 16-week deadline. • Z=(16 weeks – 15 weeks)/1.76 weeks=.57 • PERT can easily find the probability of finishing by any date they are interested in.
What PERT Was Able to Provide • Five activities (A, C, E, G, H) are on the critical path. • If any one of the critical activities is delayed for any reason, the entire project will be delayed. • Three activities (B, D, F) are not critical but have some slack time built in. • They can borrow from their resources, if needed, possibly to speed up the entire project. • A detailed schedule of activity starting and ending dates has been made available.