Download
1 / 18
180 likes | 380 Vues
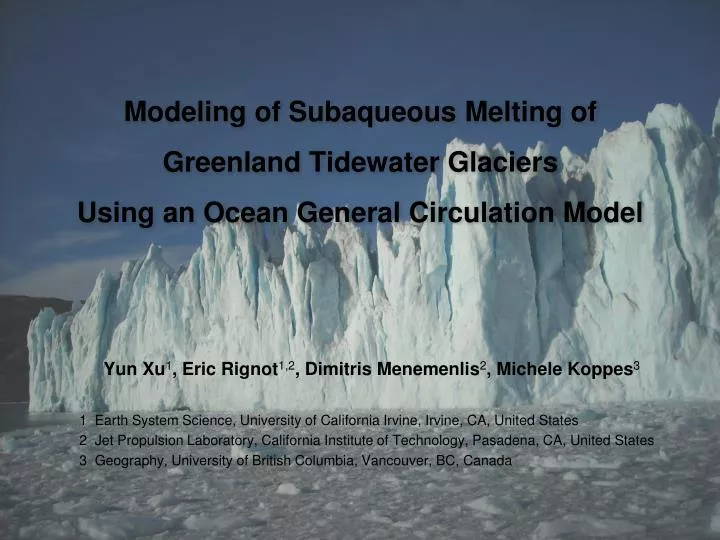
Modeling of Subaqueous Melting of Greenland Tidewater Glaciers Using an Ocean General Circulation Model. Yun Xu 1 , Eric Rignot 1,2 , Dimitris Menemenlis 2 , Michele Koppes 3 1 Earth System Science, University of California Irvine, Irvine, CA, United States

E N D
Modeling of Subaqueous Melting of Greenland Tidewater Glaciers Using an Ocean General Circulation Model Yun Xu1, Eric Rignot1,2, Dimitris Menemenlis2, Michele Koppes3 1 Earth System Science, University of California Irvine, Irvine, CA, United States 2 Jet Propulsion Laboratory, California Institute of Technology, Pasadena, CA, United States 3 Geography, University of British Columbia, Vancouver, BC, Canada
Subaqueous Melting Subaqueous melting is important for tidewater glaciers large subaqueous melt rate [m/day] a possible trigger of calving causes glacier un-grounding and retreat, trigger glacier acceleration • Melting occurs on the vertical calving faces of Greenland tidewater glaciers. • Melting will increase with ocean thermal forcing and with subglacial runoff • We need to better understand these processes Warm water Subglacial runoff (fresh, cold) (Motyka, 2003; Rignotet al., 2010)
Modeling of subaqueous melting with MITgcm Because when we put a piece of ice in the water… ΓT,ΓT follow Jenkins et al. (2010) γT0, γS0 follow Losch (2008) Melt water subglacial runoff z x
2-D Sensitivity Experiments Results • Melt rate (q) vssubglacial flux (Qsg) q depends on Qsg:q is very small when there is no Qsg, and increases sub-linearly with Qsg. • q is insensitive to channel height • q drops when the subglacial plume move at high speed and detach from the ice wall • q ~ m/d • Melt rate (q) vs thermal forcing (TF) TF = ocean temperature – freezing point q increases linearly with TF 3-D simulation on Store Gletscher Fjord
LandSat Images of Store Glacier These locations are correspoinding to the upwelling subglacial plumes 2008.07.08 http://glovis.usgs.gov/
LandSat Images of Store Glacier 2011.07.01 http://glovis.usgs.gov/
LandSat Images of Store Glacier 2011.08.02 http://glovis.usgs.gov/
Photographs of Store Glacier Best guess
Model Configuration of Subglacial Discharge (Ettema et al., 2009) 200 m3/s 200 m3/s 200 m3/s 50 m 1000 m 200 m
Calculation of Subglacial Flow Speed • Channels tend to enlarge by melting and shrink by ice deformation Balance of the two effects provides an estimate of the channel size (Röthlisberger, 1972 and Hooke et al., 1990) • Store glacier geometry:ice-water pressure difference is 1.4 bar, Channel 1: Qsg= 200 m3/s, width = 50 m, height = 10.2 m, speed = 0.57 m/s; Channel 2: Qsg= 200 m3/s, width = 1000 m, height = 0.33 m, speed = 0.93 m/s; Channel 3 : Qsg= 200 m3/s, width = 200 m, height = 2.2 m, speed = 0.68 m/s; 76 m 500 m
Plume Trajectory and Width • Based on 1-D plume model (Mugford and Dowdeswell 2009) if entrainment rate = 0.036 (Jenkins 2011) the plume quickly grows to > 10 m; if entrainment rate = 0.1 (Mugford & Dowdeswell 2009) the plume is bigger We choose horizontal resolution = 10m in the 3-D simulation. Ice front
Model Configuration for 3-D Simulation Store Gletscher free surface, non-hydrostatic Ly=5 km Lx=5 km H=500 m Qsg:T= -0.28 ̊C S=0 Resolution Δx = 10m ~ 50mΔy = 10m Δz = 5m CTD collected in August 2010 in Store glacial fjord, West Greenland used as ocean boundary condition
Results – Melt Rate Melt Rate on the Ice Face (m/d) An order of magnitude smaller Fast melting along upwelling plumes Slow melting elsewhere Average melt rate ~ 1.2 m/d
Results – Melt Rate Shows some consistence of the model simulation 2-D 3-D
Surface Velocity - view from above • Upwelling plumes push water moving away from the ice at the sea surface • Water return to the ice between upwelling plumes • Complex surface feature even without winds or tides Consistent with what we see in some videos in front of glaciers coriolis Ice front
Conclusions • The MITgcm shows that subaqueous melting depends on the subglacial runoff and the ocean thermal forcing. • 3-D simulation produces sensibly the same melt rate as that in 2-D. • Model application to Store Gletscherfjord shows that the melt rate is 4 ~ 10 m/d along the upwelling subglacial plume, 0.3 m/d away from the subglacial plume; the average melt rate is about 1.2 m/d. • Spatial distribution of subglacial runoff is unknown, and it would yield complex circulation features in front of calving face. • Several aspects require more work, e.g. • underwater observations of the subglacial runoff and plume behavior. • additional complexities of fjord circulation, e.g., tides and wind forcing.
Thank you! NASA Cryosphere Science Program Michiel van den Broeke for RACMO runoff data