Download
1 / 20
220 likes | 424 Vues
Lab 2: Estimating Population Sizes. Changes in population sizes are an indicator for important changes in community structure. Such changes may take years to become evident due to the long lifespan and slow reproduction in some seabird species.

E N D
Lab 2: Estimating Population Sizes • Changes in population sizes are an indicator for important changes in community structure. Such changes may take years to become evident due to the long lifespan and slow reproduction in some seabird species. • A change in population trends might trigger further research to investigate the causes of change, and management might formulate “species action plans” to maintain a healthy seabird community.
Today’s Objectives • Become familiar with methods of random sampling • Apply sampling methods to estimate patterns of dispersion • Understand the importance of sample size and replication and how it can affect results
What is a population? biological definition: A group of individuals of the same species in a given area
Why might we sample population size? Gasterosteus aculeatus Pacifastacus leniusculus Iris lacustris Endangered/threatened species efforts Monitor invasive species Effects of pathogen Understand impacts of different species on community structure Apis mellifera Cryphonectria parasitica Castanea dentata
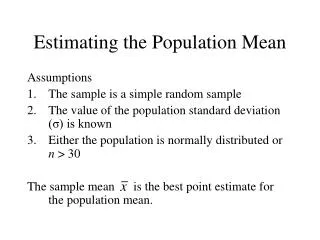
Estimating population size • Typically not feasible to sample all individuals (= actual population size) • Not enough resources • Scarce individuals • So, we estimate population sizes
Estimating population sizes can be difficult • Very small organisms • Rare species • Aquatic and arboreal • Nocturnal • Distribution pattern (random, even, or clumped)
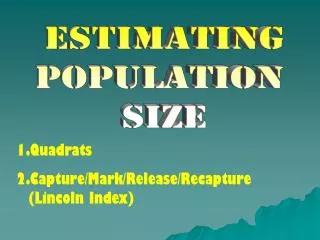
Methods Available • Census (rarely feasible) • Sampling: Mobile organisms - Mark Recapture Non mobile (mostly) - Quadrats - Point Center Quarter (PCQ)
The Quadrat • Randomize start point • Mark first point • Count the number of individuals within a quadrat *Try to be consistent with first point as corner
Point Center Quarter (PCQ) Randomize start point (center) Split to 4 Quadrants Measure distance to nearest individual in each quadrant
Problems with quadrat and PCQ • Can be affected by patchiness of the populations.
Sample Size & Replication • Sample size • Total # of observations • Replication • Repetition of an experimental treatment or sampling • One way to increase sample size • Why is it important to get a large sample size? • Improves precision of mean estimate Standard Error (SE): SE = s / √n
Today’s Lab • Estimate population size & dispersion of trees in Sanford Woodlot • Sample populations using Quadrat & PCQ methods • Return to class to analyze the data • Materials to take with you: • Random # table (pg 190) • Lab activity • Data sheet
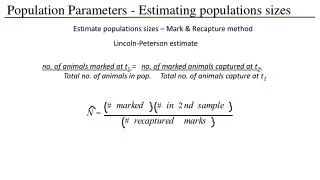
Mark-Recapture Solving for N N = nM R = • M = Total marked in first sample • n = Number in second sample • R = Number of recaptures • marked individuals in second sample • N = Total population • what we are estimating N n M R
Mark-Recapture: Assumptions Why would failure to meet assumptions affect population estimate? • All individuals in the population have an equal and independent chance of being captured. • The ratio of marked to unmarked individuals does not change between the 1st and 2nd samples. (no birth, death, em/immigration) • Marked individuals distribute themselves homogeneously with respect to unmarked individuals. N = nM R
Data Analysis • Each group calculates ‘estimation in a hectare’ for Quadrat & PCQ method • Quadrat • Count the number of individuals (x) • Find Quadrat area (Q) in m2 • (x / Qm2) * (10,000m2 / 1 ha) = # indiv./ha • PCQ • Take mean of four distance measurements in meter (d) • 10,000m2 / d2 = # indiv./ha
Data Analysis • Each group calculations ‘estimation in a hectare’ for Quadrat & PCQ method • For PCQ, calculate descriptive stats: • Mean, variance, standard deviation, standard error • For point-to-plant data, calculate coefficient of aggregation (A)
Data Analysis • Turn in sheet when finished. One per group. • After all groups are done, we’ll discuss group projects. • Review proposal feedback while you wait for other groups to finish.
Quiz (Surprise!) • 10 min • Turn over when finished • After quiz, write responses on one-third sheet: • How is your group communicating about the project? • Anything you would change about your or others’ contributions to the project? • When everyone’s finished, we will discuss group projects
Group Projects – Time to Start! • Greenhouse: see e-mails • 25 Nat Sci Lab: come during office hours • Spring break • Review proposals • Discuss with me any questions about methods • Check out any needed materials • You can continue to check out/return materials during office hours • Next week = spring break! Enjoy!