Download
1 / 1
10 likes | 86 Vues
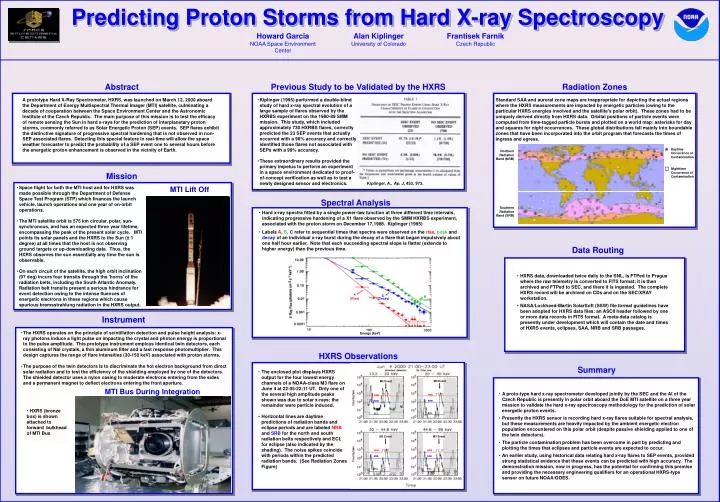
Howard Garcia NOAA Space Environment Center . Alan Kiplinger University of Colorado . Frantisek Farnik Czech Republic .

E N D
Howard Garcia NOAA Space Environment Center Alan Kiplinger University of Colorado Frantisek Farnik Czech Republic • Space flight for both the MTI host and for HXRS was made possible through the Department of Defense Space Test Program (STP) which finances the launch vehicle, launch operations and one year of on-orbit operations. • The MTI satellite orbit is 575 km circular, polar, sun-synchronous, and has an expected three year lifetime, encompassing the peak of the present solar cycle. MTI points its solar panels and the HXRS to the Sun (± 1 degree) at all times that the host is not observing ground targets or up-downloading data. Thus, the HXRS observes the sun essentially any time the sun is observable. • On each circuit of the satellite, the high orbit inclination (97 deg) incurs four transits through the 'horns' of the radiation belts, including the South Atlantic Anomaly. Radiation belt transits present a serious hindrance for event detection owing to the intense fluences of energetic electrons in these regions which cause spurious bremsstrahlung radiation in the HXRS output. • HXRS data, downloaded twice daily to the SNL, is FTPed to Prague where the raw telemetry is converted to FITS format; it is then archived and FTPed to SEC, and there it is ingested. The complete HXRS record will be archived on CDs and on the SEC/XRAY workstation. • NASA/Lockheed-Martin SolarSoft (SSW) file format guidelines have been adopted for HXRS data files: an ASCII header followed by one or more data records in FITS format. A meta-data catalog is presently under development which will contain the date and times of HXRS events, eclipses, SAA, NRB and SRB passages. Predicting Proton Storms from Hard X-ray Spectroscopy Abstract Previous Study to be Validated by the HXRS Radiation Zones • Kiplinger (1995) performed a double-blind study of hard x-ray spectral evolution of a large sample of flares observed by the HXRBS experiment on the 1980-89 SMM mission. This study, which included approximately 730 HXRBS flares, correctly predicted the 23 SEP events that actually occurred with a 96% accuracy and correctly identified those flares not associated with SEPs with a 99% accuracy. • These extraordinary results provided the primary impetus to perform an experiment in a space environment dedicated to proof-of-concept verification as well as to test a newly designed sensor and electronics. A prototype Hard X-Ray Spectrometer, HXRS, was launched on March 12, 2000 aboard the Department of Energy Multispectral Thermal Imager (MTI) satellite, culminating a decade of cooperation between the Space Environment Center and the Astronomic Institute of the Czech Republic. The main purpose of this mission is to test the efficacy of remote sensing the Sun in hard x-rays for the prediction of interplanetary proton storms, commonly referred to as Solar Energetic Proton (SEP) events. SEP flares exhibit the distinctive signature of progressive spectral hardening that is not observed in non-SEP associated flares. Detecting this special feature in real-time will allow the space weather forecaster to predict the probability of a SEP event one to several hours before the energetic proton enhancement is observed in the vicinity of Earth. Standard SAA and auroral zone maps are inappropriate for depicting the actual regions where the HXRS measurements are impacted by energetic particles (owing to the particular HXRS energies involved and the satellite's polar orbit). These zones had to be uniquely derived directly from HXRS data. Orbital positions of particle events were computed from time-tagged particle bursts and plotted on a world map: asterisks for day and squares for night occurrences. These global distributions fall mainly into boundable zones that have been incorporated into the orbit program that forecasts the times of ingress and egress. Daytime Occurrence of Contamination Northern Radiation Band (NRB) Nighttime Occurrence of Contamination Mission Kiplinger, A., Ap. J, 453, 973. MTI Lift Off Figure 1 MTI satellite: (graphic: MTI liftoff scene) Spectral Analysis Southern Radiation Band (SRB) • Hard x-ray spectra fitted by a single power-law function at three different time intervals, indicating progressive hardening of a X1 flare observed by the SMM HXRBS experiment, associated with the proton storm on December 17,1988. Kiplinger (1995) • Labels A, B, C refer to sequential times that spectra were observed on the rise, peak and decay of an individual x-ray burst during the decay of a flare that began impulsively about one half hour earlier. Note that each succeeding spectral slope is flatter (extends to higher energy) than the previous time. Data Routing (Rise) (Decay) (Peak) Instrument • The HXRS operates on the principle of scintillation detection and pulse height analysis: x-ray photons induce a light pulse on impacting the crystal and photon energy is proportional to the pulse amplitude. This prototype instrument employs identical twin detectors, each consisting of NaI crystals, a thin aluminum filter and a fast response photomultiplier. This design captures the range of flare intensities (30-150 keV) associated with proton storms. • The purpose of the twin detectors is to discriminate the hot electron background from direct solar radiation and to test the efficiency of the shielding employed by one of the detectors. The shielded detector uses a nylon casing to moderate electrons entering from the sides and a permanent magnet to deflect electrons entering the front aperture. Energy (keV) HXRS Observations Summary • The enclosed plot displays HXRS output for the four lowest energy channels of a NOAA-class M3 flare on June 4 at 22:05-22:11 UT. Only one of the several high amplitude peaks shown was due to solar x-rays; the remainder were particle induced. • Horizontal lines are daytime predictions of radiation bands and eclipse periods and are labeled NRB and SRB for the north and south radiation belts respectively and ECL for eclipse (also indicated by the shading). The noise spikes coincide with periods within the predicted radiation bands. (See Radiation Zones Figure) M3 Event M3 Event MTI Bus During Integration • A proto-type hard x-ray spectrometer developed jointly by the SEC and the AI of the Czech Republic is presently in polar orbit aboard the DoE MTI satellite on a three year mission to validate the hard x-ray spectroscopy methodology for the prediction of solar energetic proton events. • Presently the HXRS sensor is recording hard x-ray flares suitable for spectral analysis, but these measurements are heavily impacted by the ambient energetic electron population encountered on this polar orbit (despite passive shielding applied to one of the twin detectors). • The particle contamination problem has been overcome in part by predicting and plotting the times that eclipses and particle events are expected to occur. • An earlier study, using historical data relating hard x-ray flares to SEP events, provided strong statistical evidence that these events can be predicted with high accuracy. The demonstration mission, now in progress, has the potential for confirming this premise and providing the necessary engineering qualifiers for an operational HXRS-type sensor on future NOAA/GOES. NRB NRB SRB SRB • HXRS (bronze box) is shown attached to forward bulkhead of MTI Bus ECL ECL Figure 2 The Instrument: (graphic: MTI bus integration & HXRS stand-alone view) M3 Event M3 Event NRB NRB SRB SRB ECL ECL