Download
1 / 21
210 likes | 309 Vues
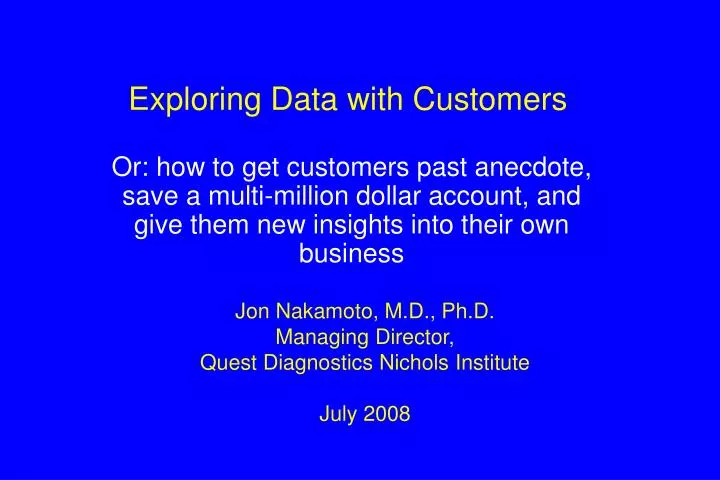
Exploring Data with Customers. Or: how to get customers past anecdote, save a multi-million dollar account, and give them new insights into their own business. Jon Nakamoto, M.D., Ph.D. Managing Director, Quest Diagnostics Nichols Institute July 2008.

E N D
Exploring Data with Customers Or: how to get customers past anecdote, save a multi-million dollar account, and give them new insights into their own business Jon Nakamoto, M.D., Ph.D. Managing Director, Quest Diagnostics Nichols Institute July 2008
Where has Tableau had the greatest financial impact for us? • Personal insights? • Internal operations? • ** Working collaboratively with customers ** • Analysis rather than anecdote and innuendo • Finding mutual improvement opportunities • Shifting customers from dissatisfied to trusting/cooperative
A brief bit about our business • Quest Diagnostics • Nichols Institute • Servicing high-end hospitals • My background and current role • How did we get to Tableau?
What is “Turnaround Time”? Transport “Logistics” Analytic (in lab) (pickup) Draw Wand Final (receipt) Release(Accession) Transmit Report Worksheet Possible client-side “dwell time” “in-house” time
What I used to get… “Can I see the 90th %ile instead of the 75th?” -- “uh, well, SPC-XL doesn’t do that…I’ll have to do it in Minitab…I’ll be back in a few hours…” “Can you stratify by week? How about by client? What about the other segments? Can you show me just the outliers?” -- “OK, but it’ll take me a while…”
Unhappy University Hospital Customer • Major university organ transplant center • Million+ dollar customer • Wants to keep their transplant physicians happy • Transplant physicians want lab results back in 48 h • Hospital calls us; COO starts using baseball analogies (“bottom of the ninth, 2 outs, 2 strikes”)
Sub-optimal Turnaround Time (severe client-side issue) Sub-optimal TAT (client-side issue + a variety of “in-house” issues) Optimal TAT “TAT segment view”: Granular and graphic XXX Hospital, CMV DNA PCR turnaround time (“TAT”)
From graphics to specifics Blood sample drawn Sunday at 9 AM Not ready for pickup until 22:00 (10 PM) Our last courier pickup was at 20:00 (8 PM) Outcome: an extra day’s wait for results
Why were results for tests drawn on Tuesday so often “late”? Wed Tue Mon Clock hour of draw Clock hour of draw Clock hour of draw Fri Thu
Why were some results still delayed? Test A: Consistent Draw Time Test B: Inconsistent Draw Time Clock hour of draw Clock hour of draw
Week of 1/21/07 (before visit) Week of 1/28/07 (after visit) Week of 2/4/07 (after visit) Week of 2/11/07 (after visit) Proof of results for the customer
Results • Compliments, rather than complaints • A sense of partnership • 25% increase in revenue by end of 2007 • Customer willingness to defy corporate mandate to move to cheaper provider
Helping hospitals analyze physician ordering patterns Ratio appears appropriate Ratio appears appropriate Ratio possibly unbalanced Ratio possibly unbalanced Ratio possibly unbalanced
Summary • Helps us understand where we need to put our efforts internally • Helps us convey to customers where collaborative efforts are needed to solve problems effectively • Has a mesmerizing effect that lowers the volume of anecdote and innuendo and increases attention to the facts • Allows us to give the customer additional insights – a delighter • Increases the sense of partnership with the customer