Download
1 / 5
80 likes | 346 Vues
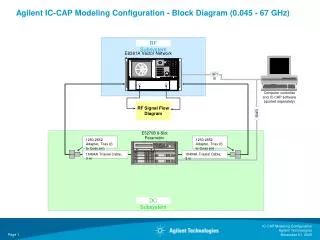
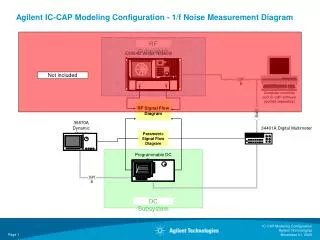
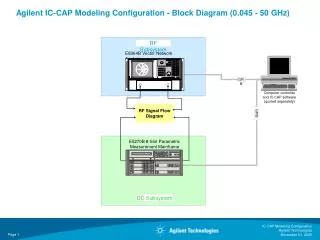
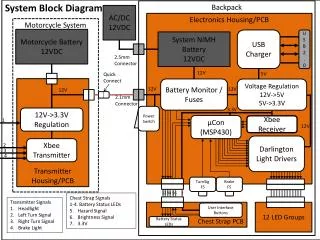
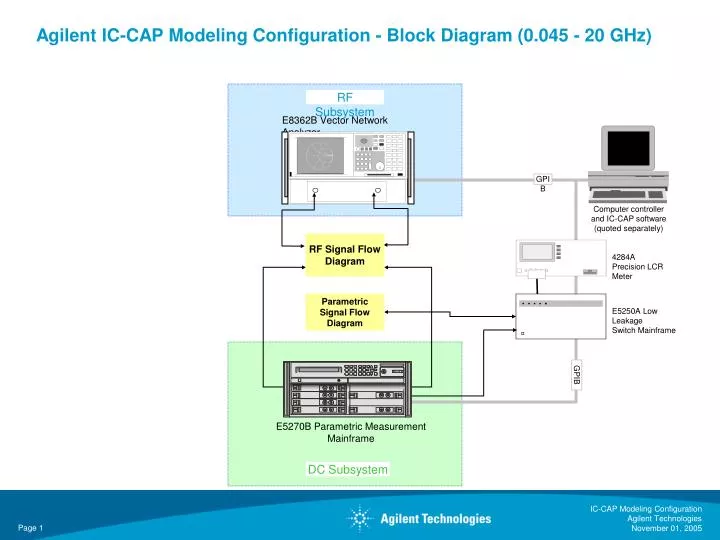
RF Subsystem. E8362B Vector Network Analyzer. GPIB. x1. 7. 8. 9. @. n. 4. 5. 6. M. m. 1. 2. 3. k. m. Computer controller and IC-CAP software (quoted separately). 0. -. RF Signal Flow Diagram. 4284A Precision LCR Meter. Parametric Signal Flow Diagram.

E N D
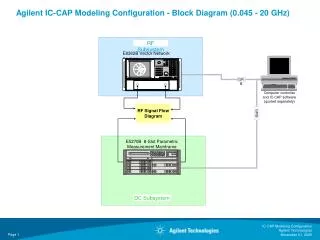
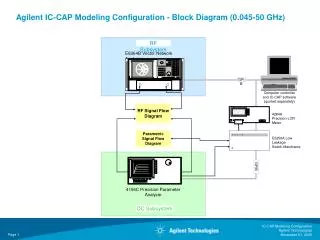
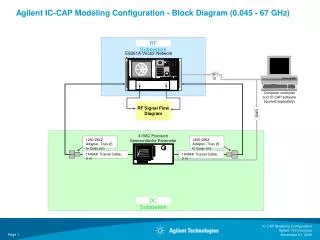
RF Subsystem E8362B Vector Network Analyzer GPIB x1 7 8 9 @ n 4 5 6 M m 1 2 3 k m Computer controller and IC-CAP software (quoted separately) . 0 - RF Signal Flow Diagram 4284A Precision LCR Meter Parametric Signal Flow Diagram E5250A Low Leakage Switch Mainframe GPIB E5270B Parametric Measurement Mainframe DC Subsystem Agilent IC-CAP Modeling Configuration - Block Diagram (0.045 - 20 GHz) IC-CAP Modeling Configuration Agilent Technologies
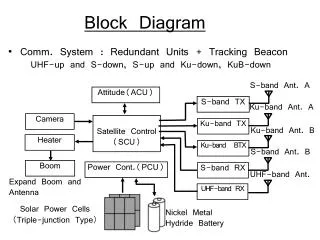
RF Subsystem 1250-1462 Adapter SMA, (f-m) 11612T K10 B.N. 11612T K20 B.N. (1) 11500E Flexible Cable, 3.5 (m-m), 61 cm f m 85131F Flexible Test Port Cable set, 3.5 mm f f Port 1 RF In RF In RF/DC Out RF/DC Out G G S S F F Probe Station or Test Fixture E8362B 1250-1748 Adapter 3.5 mm, (m-m) (1) 11500E Flexible Cable 3.5 (m-m), 61 cm Port 2 E5270B (1) 16493L #001 GNDU Cable, 1.5 m S S (2) 16494A #002 Triaxial Cable, 3 m MPSMU MPSMU F F GNDU O (2) 16494A #002 Triaxial Cable, 3 m (4) 16494A #002 Triaxial Cable, 3 m S S HPSMU HPSMU F F DC Subsystem Agilent IC-CAP Modeling - Signal Flow Diagram (0.045 - 20 GHz) IC-CAP Modeling Configuration Agilent Technologies
Alternate connection -> Direct to probe station DC Subsystem E5250A SMU INPUT (6) 16494A #002 Triaxial cable, 3 m 1 2 3 Probe Station Probe Card 4 5 6 Probe Card Cable AUX INPUT E5270B HF1 S S MPSMU MPSMU F F GNDU O 1 1 HF2 10 x 12 sw.matrix OUTPUT 10 x 12 sw.matrix OUTPUT 2 2 Hpot 3 3 Hcur 4 4 S S CV1 HPSMU MPSMU 5 5 Lpot F F 6 6 Lcur 16048D Test lead 1.89 m 1250-2405C BNC TEE 1250-2405C BNC TEE 7 7 CV2 4284A 8 8 9 9 Alternate connection -> Direct to probe station 10 10 11 11 12 12 Agilent IC-CAP Modeling Configuration - Parametric Signal Flow Diagram IC-CAP Modeling Configuration Agilent Technologies
E3661B 1.6 m Rack Cabinet E7731A Filler Panel (1-EIA) E5270B 8-Slot Parametric Measurement Mainframe E3668B Feed through Panel 4284A Precision LCR Meter x1 7 8 9 @ n 4 5 6 M m 1 2 3 k m . 0 - E8362B Vector Network Analyzer E3668B Feed through Panel Anti-static work surface E5250A Low Leakage Switch Mainframe E7735A Filler Panel (5-EIA) 35181M Drawer Unit, 5.25 inch Agilent IC-CAP Modeling Configuration - Rack Layout IC-CAP Modeling Configuration Agilent Technologies
Rack Cabinet height = 160 cm Rack Cabinet 60 cm W x 91cm D 142 cm Work Surface 100 cm W x 67 cm D Agilent IC-CAP Modeling Configuration - Rack Layout Footprint (top view) IC-CAP Modeling Configuration Agilent Technologies