Download
1 / 8
80 likes | 176 Vues
A Difficult Region for Remote Sensing Studies. Probability of imaging the Brazilian Legal Amazon Once per year…. Probability of Landsat observations from 54,451 scenes. Asner (2001) Int’l J. of Remote Sensing. MODIS Satellite Aerosol and Water Vapor Products. CLAS Flowchart.

E N D
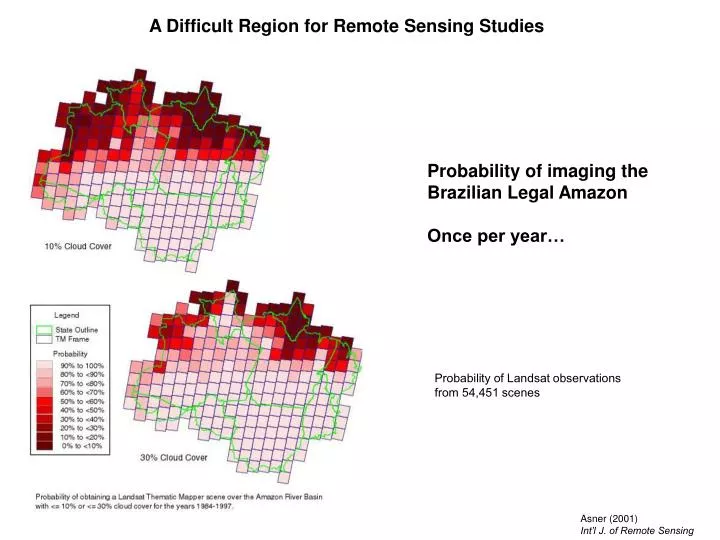
A Difficult Region for Remote Sensing Studies Probability of imaging the Brazilian Legal Amazon Once per year… Probability of Landsat observations from 54,451 scenes Asner (2001) Int’l J. of Remote Sensing
MODIS Satellite Aerosol and Water Vapor Products CLAS Flowchart Geo Correction, Resampling Conversion to Radiance Raw Landsat ETM+ Image Landsat Radiance in Optical Bands 6S Atmospheric Correction Resampling Resizing Logging Results Landsat Reflectance Thermal Band Masks Thermal-Cloud Reflectance-Water Raw-Boundary Manual Review AutoMCU Spectral Model Preliminary Logging Image Cloud Shadow Mask Mosaic-ready PV, NPV & Bare Substrate Images Raw AutoMCU Results <PV, NPV, Bare Substrate> Standard Deviation & RMS &Rescaling Final Integration Atmospheric adjustment Pattern Recognition Adjusted PV & NPV Change Images PV, NPV, RMS Change Images Differencing Before Images PV Change Criteria After Images Thermal Change Image Thermal Change Image NPV Change Criteria Linear Feature Extraction PV + NPV Texture Criteria Non-forest Mask Logging “Nodes” and Linear Feature Images
Asner et al. 2005 Earth Interactions
Asner et al. 2005 Earth Interactions
Photosynthetic Vegetation Fractional Cover (PV) and Canopy GAP 1999 2000 Asner et al. 2004 Ecological Applications Asner et al., Ecol. Apps. (in press)
Estimating Gross Carbon Flux from Selective Logging Delta-PV for each Logging Polygon PV-gap relationships (Asner et al. 2004, 2005) Delta-GAP for each Logging Polygon Gap-volume relationships (Pereira et al. 2002) Total Carbon Committed to Atmosphere Gap-Volume Relationships Volume-density (Keller et al. 2004a,b, others) Coarse Woody Debris and Collateral Carbon Losses at the Site Carbon Removed From the Site Sum with Harvest-damage relationships (Keller et al. 2004a,b) Asner et al. 2005 Science
2001 1999 2001 2000 1999 2001 2000 1999 2001 2000 1999 2001 2000 1999 1999 2000 2000 2001 2001 2001 2001 2000 1999 2001 2000 1999 2000 2000 1999 1999 1999 1999 1999 2001 1999 1999 2000 Rates of Canopy-Foliar Closure Asner et al. 2004 Ecological Applications