Download
1 / 29
290 likes | 389 Vues
Simulated and Observed Pre-Industrial to Modern Vegetation and Climate Changes. OCT 2004. Michael Notaro U.W. Madison Center for Climatic Research mnotaro@wisc.edu. OBJECTIVES. - Study the impact of rising levels of equivalent carbon dioxide on global vegetation and climate.

E N D
Simulated and Observed Pre-Industrial to Modern Vegetation and Climate Changes OCT 2004 Michael Notaro U.W. Madison Center for Climatic Research mnotaro@wisc.edu
OBJECTIVES - Study the impact of rising levels of equivalent carbon dioxide on global vegetation and climate - Evaluate FOAM-LPJ model - Focus on higher latitudes - Compare findings with satellite data and tree ring data - Later continue study to predict future changes in vegetation and climate
DATASETS • - Global Potential Vegetation (Ramankutty and Foley, 1999) • Global Continuous Fields of Vegetation Cover for 1992-1993 • (DeFries et al., 1999; 2000) • - Pathfinder V3 AVHRR FPAR (1981-2001) (Myneni et al., 1997) • HYDE Global Historical Land Cover for 1900 and 1990 (Goldewijk, • 2001; Goldewijk and Battjes, 1997) • International Tree-Ring Data Bank’s Tree Ring Width (212 sites) • (1800-1999) (45ºN-75ºN) (<500m) (standardized) • - NCEP-NCAR Reanalysis (Kalnay et al., 1996) • NASA GISS Land-Ocean Surface Air Temperature Anomalies (1900- • 1999) (Hansen et al., 1999; Reynolds and Smith, 1994; Smith et al.,1996) • Climatic Research Unit’s CRUTEM2 Monthly Land Air Temperature • Anomalies (1851-2003) (Jones and Moberg, 2003) • NOAA Extended Reconstruction SST (ERSST) (1900-1999) (Smith • and Reynolds, 2003) • Xie-Arkin CPC Merged Analysis of Precipitation (1979-2001) (Xie and • Arkin, 1996; 1997) • - CRU TS2.0 Land Surface Precipitation (1901-2000) • Willmott-Matsuura V1.01 Temperature and Precipitation (1950-1996) • (Willmott and Matsuura, 2000)
FOAM-LPJ FOAM = Fast Ocean Atmosphere Model (Jacob, 1997) - R15 (PCCM3+OM3) LPJ = Lund-Potsdam-Jena dynamic vegetation model (Sitch, 2000) - 1.4°x2.8° FOAM-LPJ = fully coupled global atmosphere-ocean-land model with dynamic vegetation
Percent difference (Model-Obs) in Annual Average Land Precipitation (Obs = Xie Arkin 1979-2001) W W D W D W W Contours: 20, 50, 100, and 300%
January and July FPAR JAN JUL OBS MODEL
Model Obs 1900 1990 FC Diff Comparison of Simulated and Satellite-Based % Tree Cover
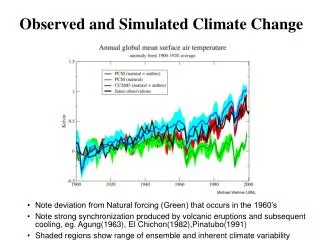
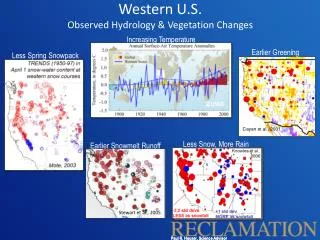
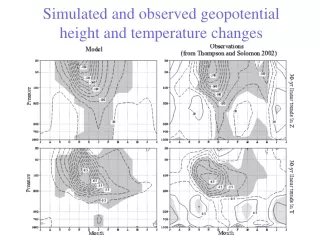
1950-1996 Surface Air T Change (Willmott-Matsuura) ANNUAL DJF
Change in Simulated Surface Air T RP P R RP-R-P Shading: <0.10
Change in Simulated Surface Air T (DJF) RP P R RP-R-P Shading: <0.10
Global Annual T DJF T (Land 38-60N, 120W-140E Global Annual SST Global Tree Cover 40-75N Boreal Summerg Tree Cover MJJAS FPAR
TREE COVER VEGETATION COVER
Trend In % Forest Cover RP R P
Change in FPAR RP P R AVHRR AVHRR Remote
Decomposition of Simulated FPAR Mean FPAR with no trend Change in leaf cover or length of growing season (GDD) Change in fractional vegetation cover Interactions or feedbacks between f and d (small) For the 9 pft’s, f = vegetation cover fraction d = seasonal leaf cover fraction
DECIDUOUS EVERGREEN
Tree Ring Width Apr-Oct T Ring Width RP R P
CONCLUSIONS - FOAM-LPJ captures the major global biomes but overproduces tree cover due to FOAM’s wet bias and LPJ’s woody bias. • Both satellite data and FOAM-LPJ reveal a global • greening trend and poleward expansion of the • northern boreal forest • The radiative forcing is responsible for most of the • warming trend, although the physiological forcing • contributes some additional local warming. - While the physiological forcing dominates the global greening trend, both forcings play a role in the boreal expansion.