Download
1 / 33
330 likes | 537 Vues
AN alysis O f VA riance (ANOVA). Comparing > 2 means Frequently applied to experimental data Why not do multiple t-tests? If you want to test H 0 : m 1 = m 2 = m 3 Why not test: m 1 = m 2 m 1 = m 3 m 2 = m 3.

E N D
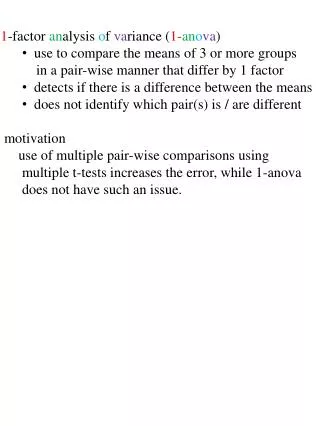
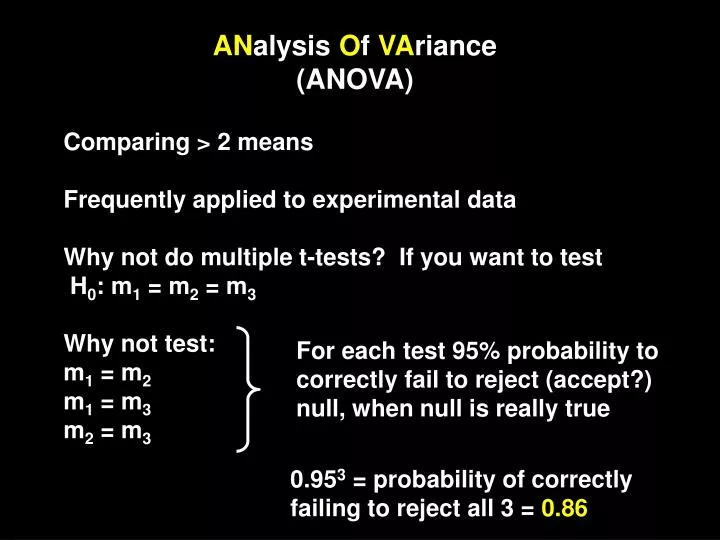
ANalysis Of VAriance (ANOVA) Comparing > 2 means Frequently applied to experimental data Why not do multiple t-tests? If you want to test H0: m1 = m2 = m3 Why not test: m1 = m2 m1 = m3 m2 = m3 For each test 95% probability to correctly fail to reject (accept?) null, when null is really true 0.953 = probability of correctly failing to reject all 3 = 0.86
Probability of if incorrectly rejecting at least one of the (true) null hypotheses = 1 - 0.86 = 0.14 As you increase the number of means compared, the probability of incorrectly rejecting a true null (type I error) increases towards one Side note: possible to correct (lower) if you need to do multiple tests (Bonferroni correction)- unusual
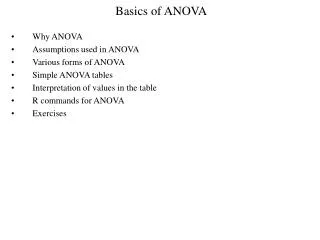
ANOVA: calculate ratios of different portions of variance of total dataset to determine if group means differ significantly from each other Calculate ‘F’ ratio, named after R.A. Fisher 1) Visualize data sets 2) Partition variance (SS & df) 3) Calculate F (tomorrow)
Pictures first 3 fertilizers applied to 10 plots each (N=30), yield measured How much variability comes from fertilizers, how much from other factors? 8 7 6 5 Overall mean Yield (tonnes) 4 3 2 Fert 1 Fert 3 Fert 2 1 0 0 10 20 30 Plot number
Thought Questions What factors other than fertilizer (uncontrolled) may contribute to the variance in crop yield? How do you minimize uncontrolled factors contribution to variance when designing an experiment or survey study? If one wants to measure the effect of a factor in nature (most of ecology/geology), how can or should you minimize background variability between experimental units?
Fertilizer (in this case) is termed the independent or predictor variable or explanatory variable Can have any number of levels, we have 3 Can have more than one independent variable. We have 1, one way ANOVA Crop yield (in this case) is termed the dependent or response variable Can have more than one response variable…. multivariate analysis (ex MANOVA). Class taught by J. Harrell
Pictures first -calculate deviation of each point from mean -some ‘+’ and some ‘-’ -sum to zero (remember definition of mean) 8 7 6 5 Overall mean Yield (tonnes) 4 3 2 Fert 1 Fert 3 Fert 2 1 0 0 10 20 30 Plot number
Sum the squared values Square all values
** why (n-1)?? Because… all deviations must sum to zero, therefore if you calculate n-1 deviations, you know what the final one must be. You do not actually have n independent pieces of information about the variance. = n-1 SS not useful for comparing between groups, it is always big when n is big. Using the mean SS (variance) allows you to compare among groups calculate ~mean SS a.k.a. variance
Partitioning Variability Back to the question: How much variability in crop yield comes from fertilizers (what you manipulated), how much from other factors (that you cannot control)? Calculate mean for each group, ie plots with fert1, fert2, and fert3 (3 group means) But first imagine a data set where…………
-Imagine case were the group (treatment) means differ a lot, with little variation within a group -Group means explain most of the variability Group means 8 7 6 5 Overall mean Yield (tonnes) 4 3 2 Fert 1 Fert 3 Fert 2 1 0 0 10 20 30 Plot number
Now…. imagine case were the group (treatment) means are not distinct, with much variation within a group -Group means explain little of the variability -3 fertilizers did not affect yield differently Group means 8 7 6 5 Overall mean Yield (tonnes) 4 3 2 Fert 1 Fert 3 Fert 2 1 0 0 10 20 30 Plot number
H0: mean yield fert1= mean yield fert2 = mean yield fert3 Or Fertilizer type has no effect on crop yield -calculating 3 measures of variability, start by partitioning SS
Sum of squares of deviations of data around the grand (overall) mean (measure of total variability) Total SS = Within group SS = (Error SS) Sum of squares of deviations of data around the separate group means (measure of variability among units given same treatment) Unfortunate word usage Sum of squares of deviations of group means around the grand mean (measure of variability among units given different treatments) Among groups SS =
k = number experimental groups Xij = datum j in experimental group I Xbari = mean of group I Xbar = grand mean Sum of squares of deviations of data around the grand (overall) mean (measure of total variability) Total SS = 2 ni k Total SS = Xij - X j=1 i=1 Sum of deviations of each datum from the grand mean, squared, summed across all k groups Total SS =
k = number experimental groups Xij = datum j in experimental group I Xbari = mean of group I Xbar = grand mean Sum of squares of deviations of data around the separate group means (measure of variability among units given same treatment) Within group SS = 2 ni k Xij - Xi Within group SS = j=1 i=1 Sum of deviations of each datum from its group mean, squared, summed across all k groups Within group SS =
k = number experimental groups Xij = datum j in experimental group I Xbari = mean of group I Xbar = grand mean Sum of squares of deviations of group means around the grand mean (measure of variability among units given different treatments) Among groups SS = 2 k Among groups SS = Xi - X ni i=1 Sum of deviations of each group mean from the grand mean, squared Among groups SS =
partitioning DF Total number experimental units -1 In fertilizer experiment, n-1= 29 Total df = units in each group -1, summed for all groups In fertilizer experiment, (10-1)*3; 9*3=27 Within group df = (Error df) Unfortunate word usage Number group means -1 In fertilizer experiment, 3-1=2 Among groups df =
SS and df sum Total SS = within groups SS + among groups SS Total df = within groups df + among groups df
Mean squares Combine information on SS and df Total mean squares = total SS/ total df total variance of data set Within group mean squares = within SS/ within df variance (per df) among units given same treatment Error MS Unfortunate word usage Among groups mean squares = among SS / among df variance (per df) among units given different treatments
Tomorrow: the big ‘F’ example calculations
Mean squares Combine information on SS and df Total mean squares = total SS/ total df total variance of data set Within group mean squares = within SS/ within df variance (per df) among units given same treatment Error MS Unfortunate word usage Among groups mean squares = among SS / among df variance (per df) among units given different treatments
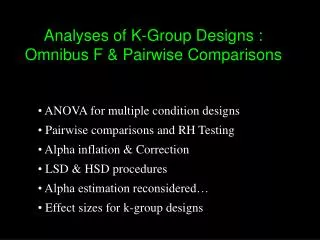
Back to the question: Does fitting the treatment mean explain a significant amount of variance? In our example…. if fertilizer doesn’t influence yield, then variation between plots with the same fertilizer will be about the same as variation between plots given different fertilizers Among groups mean squares F = Within group mean squares Compare calculated F to critical value from table (B4)
If calculated F as big or bigger than critical value, then reject H0 But remember……. H0: m1 = m2 = m3 Need separate test (multiple comparison test) to tell which means differ from which
Remember… Shape of t-distribution approaches normal curve as sample size gets very large But…. F distribution is different… always positive skew shape differs with df See handout
Two types of ANOVA: fixed and random effects models Calculation of F as: Among groups mean squares F = Within group mean squares Assumes that the levels of the independent variable have been specifically chosen, as opposed to being randomly selected from a larger population of possible levels
Exs Fixed: Test for differences in growth rates of three cultivars of roses. You want to decide which of the three to plant. Random: Randomly select three cultivars of roses from a seed catalogue in order to test whether, in general, rose cultivars differ in growth rate Fixed: Test for differences in numbers of fast food meals consumed each month by students at UT, BG, and Ohio State in order to determine which campus has healthier eating habits Random: Randomly select 3 college campuses and test whether the number of fast food meals per month differs among college campuses in general
In random effects ANOVA the denominator is not the within groups mean squares Proper denominator depends on nature of the question ***Be aware that default output from most stats packages (eg, Excel, SAS) is fixed effect model
Assumptions of ANOVA Assumes that the variances of the k samples are similar (homogeneity of variance of homoscedastic) robust to violations of this assumption, especially when all ni are equal Assumes that the underlying populations are normally distributed also robust to violations of this assumption
Model Formulae Expression of the questions being asked Does fertilizer affect yield? (word equation) yield = fertilizer response var explanatory var Right side can get more complicated
General Linear Models Linear models relating response and explanatory variables and encompassing ANOVA (& related tests) which have categorical explanatory variables and regression (& related tests) which have categorical explanatory variables In SAS proc glm executes ANOVA, regression and other similar linear models Other procedures can also be used, glm is most general
data start; infile'C:\Documents and Settings\cmayer3\My Documents\teaching\Biostatistics\Lectures\ANOVA demo.csv'dlm=','DSD; input plot fertilizer yield; options ls=80; procprint; data one; set start; procglm; class fertilizer; model yield=fertilizer; run;
The SAS System 5 12:53 Thursday, September 22, 2005 The GLM Procedure Class Level Information Class Levels Values fertilizer 3 1 2 3 Number of Observations Read 30 Number of Observations Used 30 The SAS System 6 12:53 Thursday, September 22, 2005 The GLM Procedure Dependent Variable: yield Sum of Source DF Squares Mean Square F Value Pr > F Model 2 10.82274667 5.41137333 5.70 0.0086 Error 27 25.62215000 0.94896852 Corrected Total 29 36.44489667 R-Square Coeff Var Root MSE yeild Mean 0.296962 20.97804 0.974150 4.643667 Source DF Type I SS Mean Square F Value Pr > F fertilizer 2 10.82274667 5.41137333 5.70 0.0086 Source DF Type III SS Mean Square F Value Pr > F fertilizer 2 10.82274667 5.41137333 5.70 0.0086