Download
1 / 22
280 likes | 873 Vues
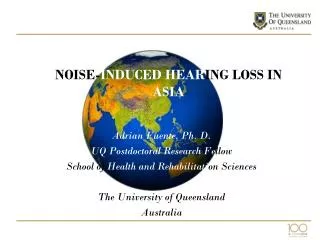
NOISE INDUCED HEARING LOSS (NIHL). SISA PRESENTATION DECEMBER 2007. Based on The Australian Safety and Compensation Council (ASCC) WORK-RELATED NOISE INDUCED HEARING LOSS IN AUSTRALIA (APRIL 2006). BY JASON SPARNON, AUDIOLOGIST & JAN MACHOTKA, AUDIOLOGIST. Introduction to NIHL.

E N D
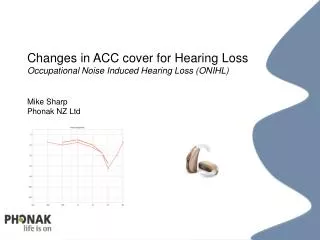
NOISE INDUCED HEARING LOSS (NIHL) SISA PRESENTATION DECEMBER 2007 Based on The Australian Safety and Compensation Council (ASCC) WORK-RELATED NOISE INDUCED HEARING LOSS IN AUSTRALIA (APRIL 2006) BY JASON SPARNON, AUDIOLOGIST & JAN MACHOTKA, AUDIOLOGIST
Introduction to NIHL NIHL is defined by National Code of Practice (2004) as hearing impairment arising from exposure to excessive noise at work, and is also commonly known as industrial deafness. NIHL is entirely preventable but once acquired it is irreversible Most recent data (2006) suggests that the number of NIHL represents 19% of all of all disease-related claims made and 3.2% of the total disease and injury related claims.
Causes of NIHL Continuous Noise exposure The extent of hearing loss increases with time of exposure, and also increases with increasing the intensity of sound levels to which an employee is exposed Greatest amount damage occurs in the first 10-15 years Most scientific evidence suggests that the hearing loss does not progress once exposure to noise has discontinued National Occupational Health and Safety Commission (NOHSC) standard identifies a continuous exposure level of 85dB(A) over 8 hrs and a maximum peak exposure level 140 dB(C)
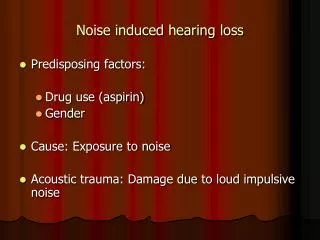
Causes of NIHL Impulsive Noise Eg Explosions and Gunfire Very high sound level eg > 140dB (c) Can result in asymmetrical loss Ototoxicity Exposure to chemicals containing ototoxins Damage usually associated with combination of ototoxins and noise Eg butanol, toluene, carbon monoxide, solvent mixtures and certain types of medications eg cancer therapy drugs and asprins
Causes of NIHL Compounding factors Non-work related Eg Congenital factors and recreational noise Role of co-factors remains poorly understood Eg cardiovascular disease, diabetes, and neurodegenerative diseases
Interpreting Audiograms • Audiograms represent the softest sound a person can hear. • Conductive loss–outer or middle ear. • Sensorineural loss –inner ear or neural pathway. Permanent. Often age or noise related. • Liability usually based upon sensorineural only X = left ear. O = Right ear [ or ] denotes bone conduction
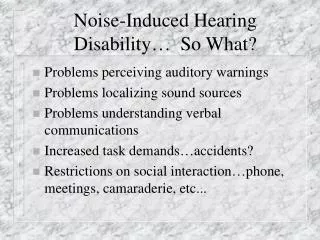
Effect of NIHL • NIHLs commonly appear as a sloping loss that is most prominent in the higher frequencies (4k) • Effects speech perception by reducing perception of consonant sounds (p,b,k,s,z etc) needed for speech clarity. • Vowels usually remain intact as there is often good residual hearing throughout the lower frequencies. • Result = clients report that they can hear people speaking but not understand them – the vowels come through clearly but the important consonants are distorted.
Progression of NIHL ( 0 – 5 years) Normal Hearing = 0% Mild high frequency loss = 4.6% (40yo), 0% (70yo)
Progression of NIHL (10 – 20 years) Moderate to severe high frequency loss = 23.8% (40yo), 18.9 (70yo) Moderate high frequency loss = 16.8% (40yo), 11.9 (70yo)
Progression of NIHL (25 + years) Moderate to Profound high frequency loss = 67.4% (40yo), 62.5% (70yo)
Calculation of percentage hearing loss (PHL) Procedure for determine PHL 1. Establish hearing threshold levels at defined frequencies: 500Hz, 1000hz, 1500Hz, 2000Hz, 3000Hz, 4000Hz 2. Go to look up tables (NAL Report No 118) for each of the frequencies to determine percentage hearing loss (PLH) for each frequency (PLH500, PLH1000…..); 3. Add up all the percentage hearing losses to give an overall figure 4. Appropriate deductions (if any) made 5. This % hearing loss (PLH) determined is used for compensation claims.
Calculation of percentage hearing loss (PHL) Deductions from PHL 1. Asymmetrical hearing loss Noise Ordinarily effects both Ears equally. ? – shooter - tumor = 21.2% = 16.8% (using L levels for R)
Calculation of percentage hearing loss (PHL) Deductions from PHL (cont’d) 2. Non-sensorineural hearing loss = 61.7 % = 16.9%
Deductions from PHL (cont’d) 3. Age related hearing loss (presbyacusis) = 23.8% (40yo), = 18.9 (70yo)
Other possible deductions 4. Pre-employment hearing loss and Congenital hearing loss 5. Non-work related medical conditions eg diabetes 6. Recreational noise exposure 7. Evidence suggests that noise exposure alone does not usually produce a loss greater than 75 dBHL at high frequencies, and 40 dBHL at lower frequencies.
Statistics of NHIL claims Table 1. Comparison of Comparison of Workers’ Compensation Arrangements.
Statistics of NHIL claims Table 2. Number of Claims for NIHL Claims in SA decreased from 370 in 1999 to 190 in 2002 Although the number of NIHL claims has been reduced, it does not mean that noise induced deafness in Australia has been reduced *most recent data available (2006)
Statistics of NHIL claims Figure 1. NIHL Claims per Exposed Employees (2001/2) Number of claims per hundred thousand employees The highest number of claims are made by: Labourers and related workers, 33% Tradespersons and related workers, 30% Intermediate production & transport workers (plant or machine operators or transport drivers),25%
Statistics of NHIL claims The average cost of workers compensation claims for NIHL in 2001/2 was calculated to be $6711. Therefore, for Australia, the direct cost of NIHL claims for 2001/2 is calculated to be $6711 x 4510 claims i.e. just over $30 million. This figure does not include Hearing Aid fittings
Prevention NIHL Noise Control and Hearing Loss Prevention Program Actions to reduce noise exposure eg. Noise insulation, ear protection Actions to monitor the health of employees eg, annual hearing screening programs Establishing a noise control policy and program noise control policy and program will enable a systematic approach to hearing conservation in a company eg purchasing policy on equipment noise levels, mandatory ear protection, training programs for employees
Services provided by Hearing Matters Who is Hearing Matters 3 audiologists – Jan, Tara, Jason Only independent clinic owned by its audiologists NOT aligned by any hearing aid manufacturer NOT solely a hearing aid clinic – also diagnostic clinic Determination of NIHL percentage and diagnostic reports. Referrals to ENT specialists when appropriate Hearing aid fittings and tinnitus treatment when appropriate Noise protection equipment
Hearing Aids • CIC: Mild – Moderate • ITC: Moderate • BTE: Moderate-Severe • Open-Fit: Mild – Severe