Download
1 / 18
180 likes | 320 Vues
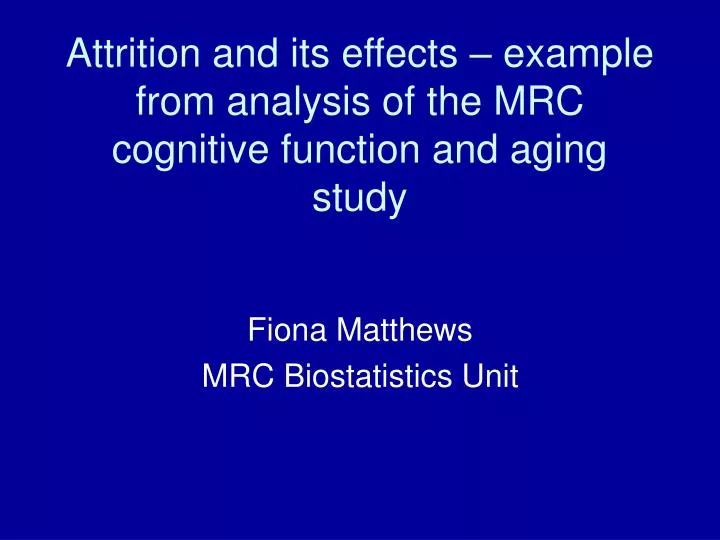
Attrition and its effects – example from analysis of the MRC cognitive function and aging study. Fiona Matthews MRC Biostatistics Unit. Outline. Background - description of the MRC Cognitive Function and Ageing study (MRC CFAS) Attrition differences Analysis methods Results Implications.

E N D
Attrition and its effects – example from analysis of the MRC cognitive function and aging study Fiona Matthews MRC Biostatistics Unit
Outline • Background - description of the MRC Cognitive Function and Ageing study (MRC CFAS) • Attrition differences • Analysis methods • Results • Implications
Aim • Estimate population cognition levels over time • But same principles arise in any outcome related to cognitive ability / dementia outcome
Why do we need to consider attrition? • Individuals who have poor cognition less likely to take part at the next interview (Missing at random) • Individuals who have poor cognition less likely to take part at this interview (informative dropout)
Attrition in the elderly • Attrition increases with age • Attrition increases with cognitive impairment • Attrition decreases with education ALL these factors are associated with outcome of interest
MRC CFAS • 13,004 individuals (5 identical centres) • Aged 65 years and above in 1991, equal numbers of 65-75 and 75+ • Rural and urban sites • Population sampling including institutions • Interviewed over ten years of follow-up • ~ 80% response rate at each stage
Principal aims The comparison of dementia and cognitive impairment across differing sites of:- • Prevalence • Incidence • Longitudinal patterns key dimensions • Biological underpinning • Implications for policy
Cognition • Cognition measured at every interview (using Mini Mental State examination – MMSE) • Individuals with poor cognition less likely to be successfully interviewed • Study design also requires measurements to be weighted
PREVALENCE SCREEN N=13004 Pr. ASSESSMENT N=2640 Inc. ASSESSMENT N=1463 SCREEN ANDASSESSMENT N=1651 FOLLOW UP N=920 SCREEN AND ASSESSMENT N=3145 FOLLOW UP N=920 SCREEN AND ASSESSMENT N=1743 INCIDENCE SCREEN N=7175 MRC CFAS study design Initial interview of ~2,500 in each of the centres A 20% subsample, weighted to more cognitively frail. Dementia diagnosis at this interview At 2 years a new assessment interview in all those currently with an assessment interview. A opportunistic one year interview was also undertaken. A new 20% subsample, weighted to cognitively impaired All individuals without an assessment at baseline were re-screened Recently completed 10 year follow-up All individuals who had previously been assessed were re-interviewed at 6-8 years.
Pr. ASSESSMENT N=2640 Inc. ASSESSMENT N=1463 SCREEN ANDASSESSMENT N=1651 FOLLOW UP N=920 FOLLOW UP N=920 INCIDENCE SCREEN N=7175 SCREEN AND ASSESSMENT N=1743 MRC CFAS study design PREVALENCE SCREEN N=13004 SCREEN AND ASSESSMENT N=3145
Attrition methods • MAR and Informative missing models can be modelled using • Full likelihood models • Inverse probability weighting • General linear growth models • Mean score imputation
Analysis method • Missing at random mechanism • First model missing data mechanism • Output probabilities become weights for individuals who are seen (can be multiplied by study weights)
Informative missing • Similar process for MAR • Model for missing also includes coefficient of current cognition and last cognition • Iterate the missing data model that removes reliance on previous cognition • Use these probabilities as weights
Conclusions • Missing data – even informative missing data does not jeoperdise conclusions • Understanding of the missing data risk factors are essential for the modelling process