Download
1 / 42
480 likes | 758 Vues
Chapter 2. Forecasting. Outline. Why Forecast? Steps in the Forecasting Process Forecasting Approaches Judgmental Time Series-- Historical Data Techniques for Averaging Techniques for Trend Techniques for Seasonality Associative Accuracy and Control of Forecasts

E N D
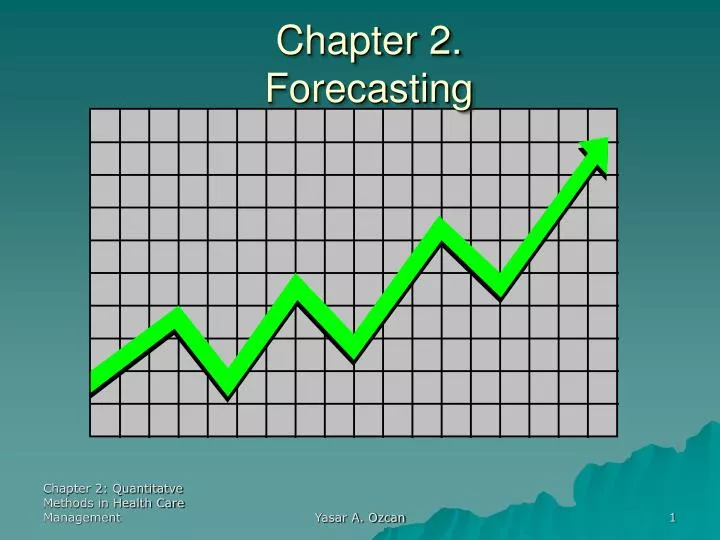
Chapter 2. Forecasting Yasar A. Ozcan
Outline • Why Forecast? • Steps in the Forecasting Process • Forecasting Approaches • Judgmental • Time Series-- Historical Data • Techniques for Averaging • Techniques for Trend • Techniques for Seasonality • Associative • Accuracy and Control of Forecasts • Choosing a Forecasting Technique Yasar A. Ozcan
Why forecasting is important? • Forecasts serve as a basis for planning • Enable health care managers to anticipate the future to plan the system and plan the use of that system • Forecasting is more than predicting demand • It is not an exact science; one must blend experience, judgment, and technical expertise Yasar A. Ozcan
All forecasts have common elements • Assumption that past continues into future • Errors occur-- actual differs from predicted; presence of randomness • Forecasts of group of items (aggregate) tends to be more accurate than individual items (i.e., departmental vs. whole hospital) • Forecast accuracy decreases as time horizon increases Yasar A. Ozcan
Characteristics of a Good Forecast • Timely • Reliable • Accurate • Meaningful units ($$’s, visits, discharges, patient days, etc.) • Easy to use Yasar A. Ozcan
Steps in the Forecasting Process Step 1 Identify the goal of the forecast Step 2 Establish a time horizon Step 3 Select a forecasting technique Step 4 Conduct the forecast (analyze data) Step 5 Determine its accuracy Step 6 Monitor the forecast Yasar A. Ozcan
What approaches can we use? • Judgmental • Delphi method • Executive opinions • Contracts/insurance/HMO/PPO/POS estimates • Consumer surveys • Outside opinions • Opinions of managers/staff Yasar A. Ozcan
The Delphi Method • Method of obtaining opinions of managers and staff • Involves circulating a series of questionnaires, each developed from the previous one, to achieve a consensus on an issue (in this case, a forecast) • Useful for forecasting technological changes and their impacts Yasar A. Ozcan
The Delphi Approach, cont. • Advantages • More individuals may be engaged than can effectively interact face-to-face • It is important to avoid bandwagon effect • Preserves anonymity of participants • Weaknesses • Questions may be ambiguous leading to false consensus • Panel members may change • Studies do not prove that Delphi forecasts are highly accurate • Preserving anonymity removes accountability Yasar A. Ozcan
Forecasting Approaches, cont. • Time series-- identify the behavior of the series by using factors such as trend, seasonality, cycles, irregular variations, and random variations • Techniques for averaging • Naive forecasts • Moving averages (MA) • Exponential smoothing • Techniques for trend • Linear equations using regression (yt = a + bxt) • Trend adjusted exponential smoothing • Techniques for seasonality • Seasonal Variations • Indices Technique Yasar A. Ozcan
Forecasting Approaches, cont. • Associative Techniques • Simple linear regression (y = a + bx) • Scatter diagram-- plot data • Correlations Yasar A. Ozcan
Figure 2.1 Variation Characteristics Seasonal Variation Seasonal Variation 2005 2004 2003 Jan Mar May Jul Sep Nov Cycle Random Variation Yasar A. Ozcan Trend
Averaging Techniques • Smooth out fluctuations in time serious because individual highs and lows cancel each other out So, would forecasts based on averages exhibit more or less variability? Yasar A. Ozcan
Naive Forecasts • A naive forecast for any period equals the previous period’s actual value • Low cost, easy to prepare, easy to understand, but less accurate forecasts • Can be applied to seasonal or trend data Examples: If last week’s demand was 50 units, the naive forecast for the coming week is 50 units. If seasonal pattern exists, the naive forecast for nextJanuary would equal the actual demand for January of this year. Yasar A. Ozcan
Moving Averages Forecast uses a number of the most recent actual data values in generating a forecast where, i = “Age” of data (i=1,2,3. . .) n = number of periods in moving average Ai = actual value with age i Yasar A. Ozcan
Moving Averages Example 2.1: An OB/GYN clinic has the following yearly patient visits, and would like to predict the volume of business for the next year for budgeting purposes. Yasar A. Ozcan
Moving Averages, cont. Solution: The three-period moving average (MA3) for period 6 is F6 = MA3 = (14272+13174+10022) ÷ 3 = 12489.3 Yasar A. Ozcan
Moving Averages, cont. The greater the number of periods in a moving average, the greater the forecast will lag with changes in the data MA3 Data MA5 1 2 3 4 5 6 7 8 9 Yasar A. Ozcan
Moving Averages, cont. • Easy to compute and understand, but data storage requirements can be high and all values are weighted equally (i.e., in a ten year moving average, each value is given a weight of 1/10, adding up to 1). • A weighted average assigns more weight to recent values Yasar A. Ozcan
Using Weighted Values Example:Continuing with Example 2.1; since there is a downward trend in visits and in period 5 there is a sharp decline, a weight of .5 or even higher is justified by the healthcare manager to calculate a weighted average for period 6 Yasar A. Ozcan
Using Weighted Values Solution: In this analysis, a weighted average, using formula [2.2], for the OB/GYN clinic for the period 6 would be: F6 = 14272*.2+13174*.3+10022*.5 F6 = 11818. Yasar A. Ozcan
Simple Exponential Smoothing • Each new forecast is based on the previous forecast plus a percentage of the difference between that forecast the actual value of the series at that point • New forecast = Old forecast + α(Actual-Old forecast), where α is a percentage or Ft = Ft-1 + α(At-1 - Ft-1), where, Ft = Forecast for period t Ft-1 = Forecast for period t-1 α = Smoothing constant At-1 = Actual demand or sales in period t-1 Yasar A. Ozcan
Exponential Smoothing, cont. Example 2.4: Using the data from Example 2.1, build forecasts with smoothing constant α = 0.3 Solution: Following the previous example and formula [2.3], we can build forecasts for periods as data become available. F3 = 15908 + .30(15504-15908) F3 = 15786.8 Yasar A. Ozcan
Exponential Smoothing, cont. Example 2.5:Using the data from Example 2.1, build forecasts with smoothing constant α = 0.5. Solution: Yasar A. Ozcan
Exponential Smoothing, cont. Example 2.6:Using the data from Example 2.1, build forecasts with smoothing constants α= 0.0 and α = 1.0. Solution: Yasar A. Ozcan
n(åxy) - (åx)(åy) n(åx2) - (åx)2 åy - båx n a = b = Techniques for Trends • Least squares regression-- minimizes the sum of the squared errors Least squares line: y = a + bx, y = predicted (dependent) variable x = predictor (independent) variable b = slope of data line a = value of y when x = 0 Yasar A. Ozcan
Figure 2.9 Linear Regression y y = a + bx error error Δy Δx b =(Δy/Δx) , where b>0 a x Yasar A. Ozcan
Techniques for Trends Example 2.7: A multi-hospital system (MHS) owns 12 hospitals. Revenues (x, or the independent variable) and profits (y, or the dependent variable) for each hospital are given below. Obtain a regression line for the data, and predict profits for a hospital with $10 million in revenues. All figures are in millions of dollars. Yasar A. Ozcan
Solution: After calculating substitute into the equations [2.5] for a and [2.6] for b, respectively. Hence, the regression line is: yx = 0.0506 + 0.01593x. To predict the profits for a hospital with $10 million in revenue, simply plug 10 in as the value of x in the regression equation: Profit = 0.0506 + 0.01593(10) = .209903 Multiplying this value by one million, the profit level with $10 million in revenue is found to be $209,903. Yasar A. Ozcan
n(åty) - (åt)(åy) n(åt2) - (åt)2 åy - båt n a = b = Techniques for Trends Linear Regression as a Trend Line y = a + b*t y = predicted (dependent) variable t = predictor (time) variable b = slope of data line a = value of y when x = 0 Yasar A. Ozcan
Example 2.8:Referring back to the OB/GYN example, the health care manager can estimate the trend line using regression analysis. Solution: Yasar A. Ozcan
Techniques for Seasonality Seasonal variations in a data set consistently repeat upward or downward movements of the data values that can be traced to recurrent events. In the additive model, seasonality is expressed as a quantity (example: 5 units), which is added or subtracted from the series average in order to incorporate seasonality. In the multiplicative model, seasonality is expressed as a percentage of the average amount (example: 1.15) Quarterly, Monthly, Daily Indices Technique Yasar A. Ozcan
Techniques for Seasonality Employing Seasonal Indices in Forecasts Example 2.10:A forecast based on linear regression yields the following trend equation Demand (Yt) = 511.06 + 1.259 t. The forecast of demand for periods 29 through 31 would be: Y29 = 511.06 + 1.259 (29) = 547.6. Y30 = 511.06 +1.259 (30) = 548.8. Y31 = 511.06 + 1.259 (31) = 550.1. Having forecast the next three months, the healthcare manager needs to incorporate seasonality back into those forecasts. The periods t = 29, 30 and 31 represent the months of November, December and January, respectively, with corresponding monthly indices 0.984, 0.973, and 1.036. Monthly adjustments to those forecasts are calculated Monthly Adjusted Forecast (t): Forecast * Monthly Index Period 29 (November): 547.6 (0.984) = 538.8. Period 30 (December): 548.9 (0.973) = 534.0. Period 31 (January) : 550.1 (1.036) = 569.9. Yasar A. Ozcan
Techniques for Seasonality Employing Seasonal Indices in Forecasts The next step in adjustment of the forecasted demand would be for daily fluctuations. As was shown in Table 2.4, Heal Me Hospital experiences daily variation in demand. Thus, the monthly index adjusted forecasts should be further adjusted for daily variations. Daily Adjusted Forecast = Monthly Adjusted Forecast (t) * Daily Index For example, for November (period 29), the adjusted forecasts for Monday and Tuesday are: Monday, November: 538.8 * (0.972) = 523.7. Tuesday, November: 538.8 * (1.023) = 551.2. Yasar A. Ozcan
How accurate are we? Forecast Error equals the actual value minus the forecasted value. Error = Actual – Forecast • Errors may be caused by: • An inadequate forecasting model • Irregular variations due to severe weather, shortages or breakdowns, catastrophes, etc. • Forecasting technique may be used improperly • There may be random variations in the data Yasar A. Ozcan
Is your forecast accurate? • Mean Absolute Deviation (MAD) MAD weights all errors evenly. • Mean Absolute Percent Error (MAPE) MAPE avoids the problem of interpreting the measure of accuracy relative to the magnitudes of the actual and the forecast values. Seek lowest of MAD or MAPE for given set of data; also examine historical performance versus responsiveness to current situation. Yasar A. Ozcan
Is your forecast accurate? Using data from Example 2.4, SES with α = 0.3, we observe the necessary error calculations in Table below. Hence, MAD = 8740.1 ÷ 4 = 2185.03, and MAPE = 8740.1 ÷ 52972 = 0.165 or 16.5%. Yasar A. Ozcan
Is your forecast accurate? • Controlling forecasts-- set predetermined upper/lower limits for forecast errors • Forecasts can be monitored using either a tracking signal or control chart. • Tracking signals show cumulative errors - Control Charts-- set upper and lower limits for individual forecast errors Yasar A. Ozcan
Control Chart for Tracking Signal Range of Acceptable Variation Need for Corrective Action -During periods 12 through 15 the tracking signal went beyond the acceptable control limits (down to -5.51), but recovered at period 16 and stayed within acceptable limits after that. -Until period 8 the predicted values were below the actual. That changed from period 9 to period 20, when forecasts were higher than actual data. -At the period 21 a return to under-forecast occurred. Yasar A. Ozcan
So what technique should we use? • Factors of importance: • Frequency • Level of aggregation • Type of Model- Errors [MAD, MAPE] • Degree of managerial involvement • Cost per forecast • Time horizon considerations-- short, intermediate, or long Yasar A. Ozcan
What makes a forecast a good one? • Timeliness • Accuracy • Meaningful Units ($$’s, visits, etc.) • In writing • Simple to understand and use Yasar A. Ozcan
The End Yasar A. Ozcan