Download
1 / 2

E N D
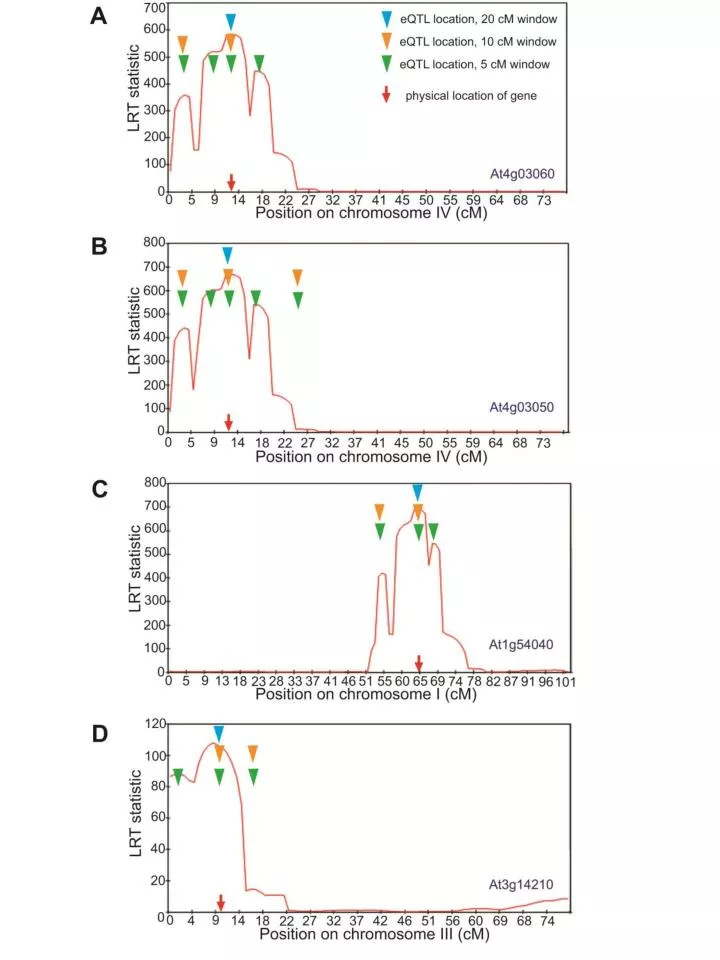
Supplemental Figure 2: Evaluation of eQTL window or range sizes (5, 10, 20 cM) for their ability to correctly locate known cis-eQTLs. The LRT traces (in red) for four transcripts with known cis-eQTLs on the chromosomes where each encoding gene is physically located. The physical position of each gene (A-D) is indicated with a red arrow on the x-axis for each graph. The location of eQTLs identified using the 5, 10 and 20 cM windows are shown with green, orange, and blue arrowheads, respectively. In all four cases, the 20 cM window most accurately indicates the position of the known gene underlying the cis-eQTL. (A) At4g03060 – AOP2, (B) At4g03050 – AOP3, (C) At1g54040 – Epithiospecifier, (D) At3g14210 – ESM1.