Download
1 / 1
10 likes | 151 Vues
Abstract. results. Pm2.5 estimations. By using a linear approach, we produce PM2.5 maps based on the AOD data obtained. We can observe high PM2.5 values where high AOD values are obtained (Figure 5a).

E N D
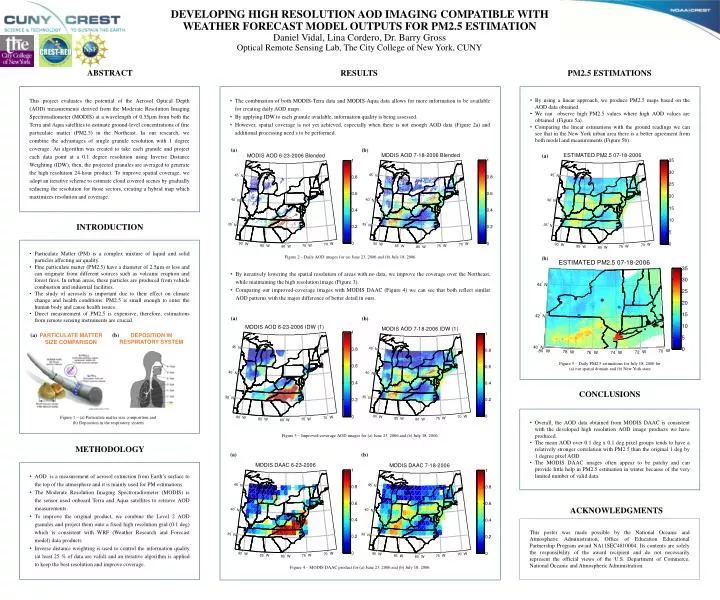
Abstract results Pm2.5 estimations • By using a linear approach, we produce PM2.5 maps based on the AOD data obtained. • We can observe high PM2.5 values where high AOD values are obtained (Figure 5a). • Comparing the linear estimations with the ground readings we can see that in the New York urban area there is a better agreement from both model and measurements (Figure 5b). • The combination of both MODIS-Terra data and MODIS-Aqua data allows for more information to be available for creating daily AOD maps. • By applying IDW to each granule available, information quality is being assessed. • However, spatial coverage is not yet achieved, especially when there is not enough AOD data (Figure 2a) and additional processing need s to be performed. Developing high resolution AOD imaging compatible with weather forecast model outputs for PM2.5 estimation Daniel Vidal, Lina Cordero, Dr. Barry Gross Optical Remote Sensing Lab, The City College of New York, CUNY (a) (b) (a) introduction • Particulate Matter (PM) is a complex mixture of liquid and solid particles affecting air quality. • Fine particulate matter (PM2.5) have a diameter of 2.5µm or less and can originate from different sources such as volcanic eruption and forest fires. In urban areas, these particles are produced from vehicle combustion and industrial facilities. • The study of aerosols is important due to their effect on climate change and health conditions. PM2.5 is small enough to enter the human body and cause health issues. • Direct measurement of PM2.5 is expensive, therefore, estimations from remote sensing instruments are crucial. Figure 2 – Daily AOD images for (a) June 23, 2006 and (b) July 18, 2006 (b) • By iteratively lowering the spatial resolution of areas with no data, we improve the coverage over the Northeast, while maintaining the high resolution image (Figure 3). • Comparing our improved-coverage images with MODIS DAAC (Figure 4) we can see that both reflect similar AOD patterns with the major difference of better detail in ours. (a) (b) This project evaluates the potential of the Aerosol Optical Depth (AOD) measurements derived from the Moderate Resolution Imaging Spectroradiometer (MODIS) at a wavelength of 0.55µm from both the Terra and Aqua satellites to estimate ground-level concentrations of fine particulate matter (PM2.5) in the Northeast. In our research, we combine the advantages of single granule resolution with 1 degree coverage. An algorithm was created to take each granule and project each data point at a 0.1 degree resolution using Inverse Distance Weighting (IDW); then, the projected granules are averaged to generate the high resolution 24-hour product. To improve spatial coverage, we adopt an iterative scheme to estimate cloud covered scenes by gradually reducing the resolution for those sectors, creating a hybrid map which maximizes resolution and coverage. (b) (a) DEPOSITION IN RESPIRATORY SYSTEM PARTICULATE MATTER SIZE COMPARISON Figure 5 – Daily PM2.5 estimations for July 18, 2006 for (a) our spatial domain and (b) New York state conclusions • Overall, the AOD data obtained from MODIS DAAC is consistent with the developed high resolution AOD image products we have produced. • The mean AOD over 0.1 deg x 0.1 deg pixel groups tends to have a relatively stronger correlation with PM2.5 than the original 1 deg by 1 degree pixel AOD. • The MODIS DAAC images often appear to be patchy and can provide little help in PM2.5 estimation in winter because of the very limited number of valid data. Figure 1 – (a) Particulate matter size composition and (b) Deposition in the respiratory system Figure 3 – Improved-coverage AOD images for (a) June 23, 2006 and (b) July 18, 2006 methodology (a) (b) • AOD is a measurement of aerosol extinction from Earth’s surface to the top of the atmosphere and it is mainly used for PM estimations. • The Moderate Resolution Imaging Spectroradiometer (MODIS) is the sensor used onboard Terra and Aqua satellites to retrieve AOD measurements. • To improve the original product, we combine the Level 2 AOD granules and project them onto a fixed high resolution grid (0.1 deg) which is consistent with WRF (Weather Research and Forecast model) data products. • Inverse distance weighting is used to control the information quality (at least 25 % of data are valid) and an iterative algorithm is applied to keep the best resolution and improve coverage. acknowledgments • This poster was made possible by the National Oceanic and Atmospheric Administration, Office of Education Educational Partnership Program award NA11SEC4810004. Its contents are solely the responsibility of the award recipient and do not necessarily represent the official views of the U.S. Department of Commerce, National Oceanic and Atmospheric Administration. Figure 4 – MODIS DAAC product for (a) June 23, 2006 and (b) July 18, 2006