Download
1 / 16
160 likes | 163 Vues
Asset Management Economic Analysis for Small Meter Replacement Eric Brainich Asset Manager Portland Water Bureau May 2008. Small meter in Portland. Portland Water Bureau small meters Replacement cost = $13 million Annual income measured by small meters: $23 million for water

E N D
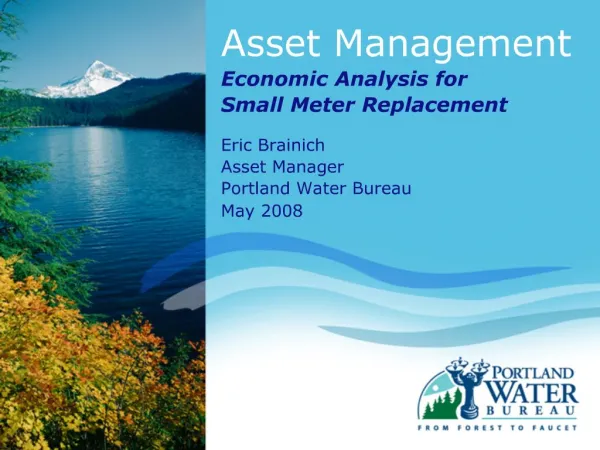
Asset Management Economic Analysis for Small Meter Replacement Eric Brainich Asset Manager Portland Water Bureau May 2008
Small meter in Portland Portland Water Bureau small meters Replacement cost = $13 million Annual income measured by small meters: $23 million for water $56 million for sewer
Methodology • 5/8” meters • Estimate meter degradation curve • Calculate unrecorded water revenue loss as meter accuracy declines during life of meter • Cost of replacing meter • Minimize life-cycle cost of meters
Estimating meter degradation Factors to consider in estimating degradation: • Make/model of meter Model A & Model B • Consumption (vs. age) of meter 500 / 1000 / 1500 / 2000 / 2500 / 3000 ccf • Test flow rates Low = 0.25/0.5/1.0 gpm Medium = 3 gpm High = 10 gpm • Weighted flow rates Low = 15% Medium = 75% High = 10%
Estimating meter degradation • Random sample of 441 5/8” meters (222 of Model A and 219 of Model B) • Minimum 30 samples for each model and consumption category • Plotted on GIS to provide qualitative check to ensure randomness of sample data
AWWA meter guidelines1 • Removal from service based on accuracy and meter type. • Recommends using sample test data to identify groups of meters with accuracy problems to ensure money used to exchange meters is spent on the poorest performing meters. 1/ Taken from M6 Manual
Conclusions & Recommendations • Least-cost life-cycle analysis used to justify replacement timing (ensures cost of program not more than “revenue loss” or rate increase needed to cover unrecorded water usage) • Random sample of meters • Weighted flow rates depend upon local consumption patterns