Download
1 / 38
380 likes | 384 Vues
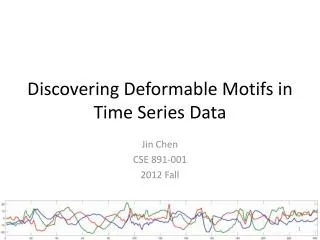
This framework aims to discover anomalous regimes in time-series data by estimating local models and comparing them to a reference dataset. It provides a hypothesis testing framework for detecting anomalies and has shown promising results on real and synthetic problems.

E N D
A Framework for Discovering Anomalous Regimes in Multivariate Time-Series Data with Local Models Stephen Bay Stanford University, and Institute for the Study of Learning and Expertise sbay@apres.stanford.edu Joint work with Kazumi Saito, Naonori Ueda, and Pat Langley
Discovering Anomalous Regimes Problem: Discover when a section of an observed time series has been generated by an anomalous regime. • Anomalous: extremely rare or unusual • Regime: the hypothetical true model generating the observed data
Motivation • variables causally related • several different modes charge nasa.gov voltage temp. current www.ndi.org
Other Categories of Irregularities • Outliers • Unusual patterns
Discovering Anomalous Regimes in Time Series DARTS Framework 1. Reference and Test data 2. Local Models Estimate on windows Map into parameter space 4. Anomaly score Estimate density of T according to R compute threshold 3. Parameter space
Local Models Vector Autoregressive models Regression format Ridge Regression
Scoring and Density Estimation Estimate the density of local models from T relative to R in the parameter space Kernels NN style
Determining a Null Distribution • Score function provides a continuous estimate but some tasks require hard cutoff • Null Distribution: • the distribution of anomaly scores we would expect to see if the data was completely normal • Resample R and generate empirical distribution from block cross-validation • Provides hypothesis testing framework for sounding alarms Anomaly score Empirical distribution
Computation Time • Local Models • Linear in N (reference and test) • Cubic in number of variables (for AR) • Linear in window size (for AR) • Density Estimation • Implemented with KD-trees • Potentially NT log NR • Can be worse in higher dimensions
Experiments • Why evaluation is difficult • Data sets • CD Player • Random Walk • ECG Arrhythmia • Financial Time-Series • Comparison Algorithms • Hotelling’s T2 statistic
Hotelling’s T2 Statistic • Commonly used in statistical process control for monitoring multivariate processes • Basically the same as Mahalanobis distance • Applied with time lags for patient monitoring in multivariate data (Gather et al., 2001)
CD Player • Data from mechanical cd player arm • Two inputs relating to actuators (u1,u2) • Two outputs relating to position accuracy (y1,y2)
Random Walk • No anomalies in random walk data
Cardiac Arrhythmia Data • Electrocardiogram traces from MIT-BIH • Collected to study cardiac dynamics and arrhythmias • Every beat annotated by two cardiologists • 30 minute recording @ 360 Hz • Roughly 650,000 points, 2000 beats • Points 100-3000 reference set • remainder is test data
DARTS V a a
Hotelling’s T2 V a a
DARTS j j j
DARTS a
TP/FP Statistics Sensitivity = TP / (TP + FN) Selectivity = TP / (TP + FP)
Japanese Financial Data • Monthly data from 1983-2003 • Variables: • Monetary base • National bond interest rate • Wholesale price index • Index of industrial produce • Machinery orders • Exchange rate yen/dollar • True anomalies unknown • subjective evaluation by expert
Hotelling’s T2 vs. DARTS T2 can detect multivariate changes but, • Has little selectivity • Does not distinguish between variables • Does not handle drifts • F-statistical test often grossly underestimates proper threshold
Limitations of DARTS • Suitability of local models • Window-size and sensitivity • Number of parameters • Overlapping data • Efficiency of KD-tree • Explanation
Related Work • Limit checking • Discrepancy checking • Autoregressive models • Unusual patterns • HMM’s
Conclusions • DARTS framework • Data -> local models -> parameter space -> density estimate • Provides hypothesis testing framework for flagging anomalies • Promising results on a variety of real and synthetic problems
DARTS Framework • Preprocess R and T • Select target variable and create local models from R • Create local models from T • Compare models of T to R in space P • Compute Null Distribution • Repeat steps 2-5 for each variable