Download
1 / 25
270 likes | 423 Vues
A Three-Dimensional Variational Data Assimilation in Support of Coastal Ocean Observing Systems. Zhijin Li and Yi Chao Jet Propulsion Laboratory Jim McWilliams and Kayo Ide UCLA. ROMS User Workshop, October 2, 2007, Los Angeles.

E N D
A Three-Dimensional Variational Data Assimilation in Support of Coastal Ocean Observing Systems Zhijin Li and Yi Chao Jet Propulsion Laboratory Jim McWilliams and Kayo Ide UCLA ROMS User Workshop, October 2, 2007, Los Angeles
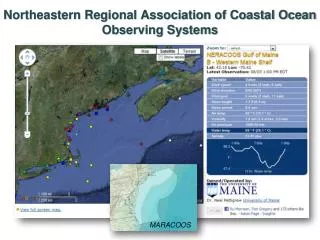
Integrated Ocean Observing System (IOOS):Modeling, data assimilation, forecasting and adaptive sampling Theoretical Understanding & Numerical Models Users: Managers Education & Outreach Observations (satellite, in situ) Data Assimilation Products Information Observing System Design Feedback & Adaptive Sampling
Outline • Real-time Regional Ocean Modeling System (ROMS) • Three-dimensional variational data assimilation • Assimilated observations • Evaluation of analyses and forecasts • Observing system experiments (OSE) • Relocatability
ROMS Simulation HF Radar Obs Sea Surface M2 Tidal Currents Coupled with Tides Tide Gauge RMS Error of SSHs
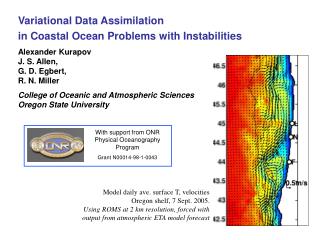
Modeling Approach 15-km 5-km 1.5-km Regional Ocean Modeling System (ROMS): From Global to Regional/Coastal 12-km Multi-scale (or “nested”) ROMS modeling approach is developed in order to simulate the 3D ocean at the spatial scale (e.g., 1.5-km) measured by in situ and remote sensors
Data Assimilation Data Assimilation Model When the numerical model is so good as its prediction is superior to the climatological (almanac) forecast
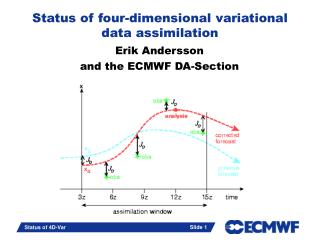
ROMS Analysis and Forecast Cycle: Incremental 3DVAR y: observation x: model 3-day forecast xf 6-hour forecast 6-hour assimilation cycle xa Initial condition Time Aug.2 00Z Aug.1 18Z Aug.1 06Z Aug.1 12Z Aug.1 00Z
Why a There-Dimensional Variational Data Assimilation • Real-time capability • Implementation with sophisticated and high resolution model configurations • Flexibility to assimilate various observation simultaneously • Development for more advanced scheme
Geostrophic balance Vertical integral of the hydrostatic equation ageostrophic streamfunction and velocity potential 3DVAR: Weak Geostrophic Constraint and Hydrostatic Balance
Inhomogeneous and anisotropic 3D Global Error Covariance Cross-shore and vertical section salinity correlation SSH correlations Kronecker Product
Assimilated observations:Satellite infrared SSTs Microwave, Low resolution (25km) No cloud contamination Infrared, High resolution Cloud contamination NOAA GOES NASA Aqua AMSR-E NASA TRIMM TMI NOAA AVHRR
Assimilated observations:Satellite SSHs along track JASON-1 Resolution: 120km cross track, 6km along track
Integrated Ocean Observing Systems • T/S profiles from gliders • Ship CTD profiles • Aircraft SSTs • AUV sections AOSN-II
Assimilated Current Observations Shipboard Bottom Buoy Acoustic Doppler Current Profiler(ADCP) High Frequency Radar Mapped 2D surface current
3.5DVar If FDAT 3DVar is equivalent to 4DVar 3DVAR with First Guess at Appropriate Time (FGAT)
ROMS Performance Against Assimilated Data August 2006 Mean All Gliders RMS Diff Mean Diff Temperature (C) -0.3 0.3 0.0 0.75 Salinity (PSU) -0.1 0.1 0.0 0.20
Comparison of Glider-Derived Currents (vertically integrated current) AOSN-II, August 2003 Black: SIO glider; Red: ROMS
Predictability during AOSN-II Forecast Correlation RMSE Note: because gliders are moving, one cannot estimate the persistence
Observing System Experiment (OSE) – Typically aimed at assessing the impact of a given existing data type on a system – Using existing observational data and operational analyses, the candidate data are either added to withheld from the forecast system – Assessing the impact
Observing System Experiment (OSE):Glider Data Denial Experiment Temperature RMS Error Salinity w/o CalPoly glider with CalPoly glider SIO CalPoly WHOI 1st week 2nd week
Impact of HF Radar HF radar ROMS without HF radar data assimilation ROMS with HF radar data assimilation
Southern California Bight US WEST COAST Southern California Coastal Ocean Observing System (SCCOOS) http://ourocean.jpl.nasa.gov/SCB
Real-Time SCCOOS Data Assimilation and Forecasting System http://ourocean.jpl.nasa.gov/SCB
Toward a Relocatable ROMS Forecasting System:Demonstration for Prince William Sound, Alaska 9-km 3-km 1-km