Download
1 / 31
310 likes | 399 Vues
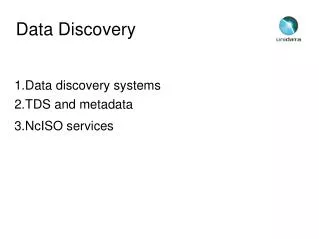
Positioning Data Discovery for Greater Impact. October 2014. Agenda. Landscape. Department of Public Welfare. DW. EDW. DW. EDW - Landscape. Office of Developmental Programs (ODP) Office of Long Term Living (OLTL) Office of Medical Assistance Program (OMAP)

E N D
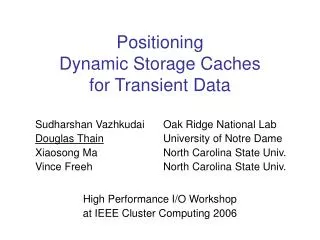
Positioning Data Discovery for Greater Impact October 2014
DW EDW DW EDW - Landscape • Office of Developmental Programs (ODP) • Office of Long Term Living (OLTL) • Office of Medical Assistance Program (OMAP) • Office of Mental Health and Substance Abuse Services (OMHSAS) • Office of Children, Youth and Families (OCYF) • Office of Child Development & Early Learning (OCDEL) • Pennsylvania Department of Education (PDE) • Enterprise Incident Management • ODP • OLTL • Office of Medical Assistance Program (OMAP) PIMS Bridge (OCDEL-PDE) Technology: Cognos, Informatica, Oracle 10G • Pennsylvania Insurance Department (PID) • Office of Children, Youth and Families (OCYF) • Office Income Maintenance (OIM) Technology: Cognos 10.2, Informatica 9, Oracle 11G Technology: Cognos 7, Decision Stream, Oracle 10G
Business Analytics Capabilities What might happen? Stage 4: • Predictive Analytics: • Incident prediction • Financial forecasting • Service effectiveness • Fraud detection and prevention • Mobile Analytics: • Alerts • On-the-go Metrics Why is it happening? Stage 3: Strategic impact What is happening? Stage 2: • Ad hoc capabilities: • Self service reports • OLAP cubes • Monitoring KPIs: • Dashboards • Scorecards Positioning Data Discovery • Pre-defined Reporting: • Prompt reports • Scheduled reporting Stage 1: • What is available? Investment in Information Management Data Gathering Static Reporting Business Intelligence Analytics Advanced Analytics
Oracle Endeca Endeca is a complete solution for agile data discovery across the enterprise, empowering business user independence in balance with IT governance. Endeca offers fast, intuitive access to both traditional analytic data and non-traditional data, including external and unstructured information. • Sophisticated data integration and ETL streamline access to enterprise sources, including Oracle Business Intelligence • Agile, data-driven approach requires no up-front modeling, for fast time to value • In-memory architecture and innovative caching deliver extreme performance In Memory Analytics Robust Data Integration Oracle Endeca Deep Text Analysis Self Service Discovery • Easily create, configure, and securely share discovery applications within the context of enterprise governance and security • Upload information from a wide array of self service sources including Excel, JSON, and any data source accessible via JDBC Consulting • Powerful text analytics extracts key themes and sentiments • Support for sentiment analysis in 10 languages, localization in 13, and search and self-service term extraction in 33+ enable truly global analytics Enterprise Data Discovery • State-of-the-art search and guided navigation surface insights with a click • Live data enrichment allows users to enhance analytics in the moment
Value Proposition & Applications • Unstructured/Semi- • Structured Data Analysis Endeca allows for the ingestion of unstructured and semi-structured data and provides analytics capabilities to uncover hidden trends and details Endeca allows for rapidly assimilation of data from multiple sources to garner an executive view of the data from across multiple data stores • Fragmented Source • Compilation • Transactional/Stage Data • Discovery Endeca allows for applications to be created directly on source and stage data which help Program Office Business Analyst’s slice and dice information to uncover previously un-realized questions to complement enterprise reporting requirements Self-Service Enablement Its capability for Program Office Business Analyst’s to upload diverse data for snapshot analysis with minimal dependence on IT for basic data setup and support • Web Sentiment Analysis Ability to setup web crawls for gathering data and provision online sentiment analysis which could potentially lead to drawing correlations with enterprise data
Perceived Benefits • Fragmented Source Compilation • Combining EDW, OCYF, and CY48 data allowed program offices to drill into causes for heightened days for investigation and expose potential reasons for bottlenecks • OIM compilation of demographics, census, and CQCCOM service information helped draw a holistic view of the recipients • 2. Advanced Analytics • Sentiment analysis of structured and un-structured data which includes whitelist tagging and text extractions, alongside spreadsheet consumption and visualization • Built-in mapping and advanced visualization engines like tag clouds and capabilities for negative refinements • 3. Data Validations • Provisioning access to view data captured by OCYF enabled a window into potential future enterprise reporting needs • Access to previously unavailable SAMS, eCIS, and HCSIS transaction data • 4. Delivery Cycles • Typical delivery cycle for an Endeca project is 8-12 weeks with a 16-20 week update cycle based on end-user feedback for required enhancements • 2-4 week cycles for applications built using self-service for a quick window into the data
DPW Enablement Objectives The objectives being targeted with the initial 25 user enablement: Enterprise-wide Adoption • Uncover the potential landscape for the application of Endeca within the department • Determine use and adoption of Endeca and the concept of data discovery across program offices Concept Positioning • Build the utilization of the complete set of Endeca’s standard capabilities • Blend its use within the existing Business Intelligence/Data Analytics Landscape Solution Scalability • Determine factors to be considered during deployment within the Enterprise for a significant user-base • Document governance for People, Process, and Technology considerations encompassing rollouts
Timelines & Targets Phase 1 Phase 2 Wave 2 Wave 3 Wave 2 Wave 1 (Initiation) Wave 1 (Initiation) Wave 3 Configurations, assessments and initiate attempts to build end-user content for program offices Basic Install, capability demonstration and Self-Service Enablement Gain targeted adoption and consensus for an enterprise rollout Gain targeted adoption and consensus for an enterprise rollout Configurations, assessment and initiate attempts to build end-user content for program offices Basic Install, capability demonstration and Self-Service Enablement Implementation Timeline Wave 1 Lessons Learned Executive Touch Points
Key Findings and Benefits The development of the self service applications for the program areas resulted in common themes across the program offices. • Findings – Data/Application Rendition • Allows for rendering previously unavailable data for mining and analysis • Provides access to unstructured and fragmented data • Allows for the ability to include traditional and non-traditional sources • Gaps and limitations that warrants governance through maintenance cycles • Benefits • Exposed fraudulent activity to drive cost savings • Exposed issues with data quality and corresponding business analysis implications • Showed previously unknown information and sentiments captured within comments • Shortened build cycles of 2-4 weeks for demos/POCs • Accelerated end user delivery of feedback and enhancements • Ability to decide if POC should be developed into ongoing report • 8-12 week production application delivery alongside total 16-20 week window for incorporating end-user driven enhancements
Advanced Visualization & Data Mashup Advanced visualizations like geo-spatial maps allowed for a simplified user-experience in uncovering insights Data Mashups allowed for merging and drawing comparisons across internal & external data sources
Negative Refinement Review of SNAP transactions for the month. Appears most transactions occur within our state. What happens if we remove PA and border states?
Negative Refinement (cont.) Information appears that we may not have known. We see transactions occurring outside of PA and bordering states. Opportunity for further evaluation and discovery on that information.
Advanced Analytics Capabilities for Tag Cloud highlights and Summarizations drive Advanced Analytics Ability to house vast amounts of data within domains propagated “big data” mining and exploration Ability to quickly perform a ‘negative’ refinement. Remove the big number to see what remains and may discover new unknowns.
Big Data Mining Ability to house roughly 100 million records within a single domain provisioned capabilities to mine otherwise unusable data resulting in fraud prevention and summarized reporting
Current State & Future Vision While the current applications were created by IT, there is an ability to transition development to program office users based on the vision of the rollout. Future Vision End-User/Program Office Driven Self-Service 50% - 50% BIS/ IT Driven Self-Service • Program Office/ End-User Driven Self-Service (10% Utilization) • Technical/Super users within program office currently driven to utilize capability • Limited time/effort availability and tool or conceptual knowledge gaps • Challenges with utilizing self-service capabilities • Considerations to increment adoption: Endeca training (Train the trainer), Identify program office FTEs developers, Re-use content across applications • IT Supported Self-Service (90% Utilization) • Conducted initial conversations with program offices for insights into challenges with data availability and analysis • Built out drafts to highlight possibilities leveraging Endeca • Follow-up sessions with program office stakeholders to finalize application layouts and drive long-term value • Governance for environment stability and functionality deliverance • Considerations for decreasing involvement: Involvement just with alleviating roadblocks, Augmenting re-usable content (e.g. Blacklists)
Long Term Concept Positioning Governed use of Self-Service for snapshot analysis IT/BIS Supported Self-Service Program Office/ End-User Driven Self-Service Future Automated Endeca Production Applications for RegularUse Uncover use-cases/KPIs for Enterprise Reporting through Cognos
Today Tomorrow Future High Level roadmap 3. Deployed to All Program Offices; 100+ Users 5. Enterprise Wide Adoption 4a. IT Provisioned Applications to Program Offices Production Pilot 25 NUP 4. Scale Users & Data Volumes; Expand Self Service Apps 2. Expand Deployment to Program Areas for Self Service Apps Future
Current Configuration Studio Server Endeca Server Current (Test & Development) Configuration Server List Integration Suite Server + Text Enrichment & Sentiment Analysis • Server Configuration • Up to 8 cores • 64 GB RAM minimum • 128GB+ recommended • User count • Up to 25 users Test/Dev Configuration • User count • Up to 25 users • Server Configuration • Up to 4 cores • 8 GB RAM minimum • 16GB+ recommended
Perceived Future State Studio Server Endeca Server Option 1 OVM Server List • Server Configuration • Up to 24 cores • up to 1.856 TB RAM • Server Configuration • Up to 8 cores • 64GB RAM Integrator Server • User count • Up to 100 users Enterprise Configuration • Exalytics Hardware Platform • 40 total cores • Hard partitioning allows you to • only license what you need • - 2 TB of RAM • - 2.4 TB of Flash Disk • Server Configuration • Up to 8 cores • 128 GB RAM • User count • Up to 100 users
Potential Outcomes • Pros • Improved end user experience and productivity • Efficiently leverage the power of Exalytics by licensing 100% of the server • Cons • No room on Exalytics for future growth • Single points of failure at the Studio / Endeca Server tiers Server List Estimated Sizing
Perceived Future State Endeca Server Cluster Node 1 Endeca Server Cluster Node 2 Option 2 OVM Integration Suite Server + Text Enrichment & Sentiment Analysis Studio Server Configuration - Up to 24 cores - Up to 2 TB of RAM - 2.4 TB of Flash Disk • User count • up to 150 Users • User count • up to 150 Users • Server Configuration • 4-8 cores • 8 GB RAM minimum • 64GB+ recommended
Potential Outcomes • Pros • Clustered design removes single points of failure • Enable Consistent, Stable, & Scalable Application • Room to Grow on each server, supporting Future Growth • Greater user adoption and experience • High Availability for Business Continuity • Cons • Clustered design makes CPU studio pricing for unlimited users less attractive Estimated Sizing Enterprise Configuration