Download
1 / 7
100 likes | 336 Vues
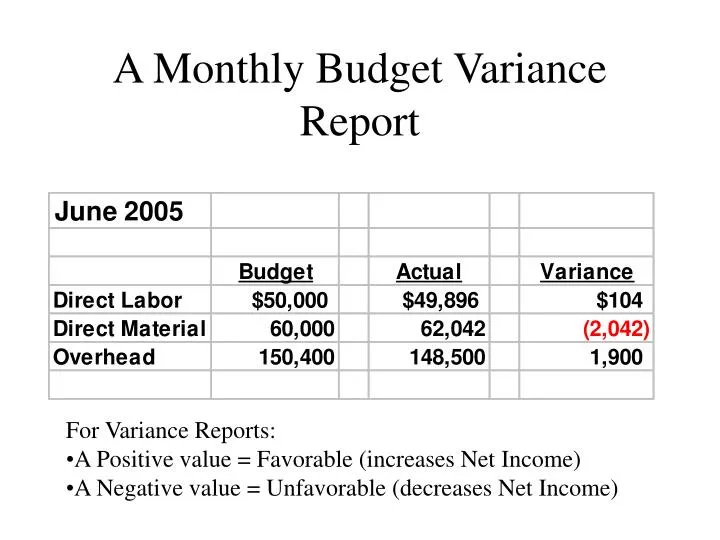
A Monthly Budget Variance Report. For Variance Reports: A Positive value = Favorable (increases Net Income) A Negative value = Unfavorable (decreases Net Income). Variance Analysis. There are two sources of Variance between BUDGETS and ACTUALS. Spending differences

E N D
A Monthly Budget Variance Report • For Variance Reports: • A Positive value = Favorable (increases Net Income) • A Negative value = Unfavorable (decreases Net Income)
Variance Analysis There are two sources of Variance between BUDGETS and ACTUALS. • Spending differences • Variance due to the COST paid for resources (price or rate) • AQ (AP – SP) • Volume differences • Variance in the QUANTITY used (volume or level of activity) • SP (AQ – SQ)
The Variance Format AQ = Actual Quantity or Actual Volume or Actual Hours AP = Actual Price or Actual Rate SQ = Standard Quantity or Standard Volume or Standard Hours AP = Actual Price or Actual Rate ACTUAL QUANTITY AT STANDARD PRICE AQ x SP ACTUAL QUANTITY AT ACTUAL PRICE (ACTUALS) AQ x A P STANDARD QUANTITY AT STANDARD PRICE SQ x S P 1 2 3 1 – 2 = PRICE VARIANCE AQ(AP-SP) 2 – 3 = QUANTITY VARIANCE SP(AQ-SQ) TOTAL VARIANCE (1 - 2) + (2 - 3) • Negative Variances are Favorable (a credit to Overhead Variance) • Positive Variances are Unfavorable (a debit to Overhead Variance)
Where is the information found? (1) Actual $$$ given on monthly Variance Analysis report (3) Budgeted $$$ given on monthly Variance Analysis report (2) Calculated by getting AQ and SP from Accounting or other source of budget information = AQ x AP = AQ x SP = SQ x SP ACTUAL COSTS (PROVIDED BY ACCOUNTING) ACTUAL AMOUNT OF RESOURCE AT STANDARD PRICE (CALCULATED) BUDGETED COSTS (PROVIDED BY ACCOUNTING) 1 2 3 1 - 2 SPENDING VARIANCE 2 - 3 VOLUME VARIANCE TOTAL VARIANCE (1 - 2) + (2 - 3)
Graphical Analysis OH $$ Spending Variance due to Price (rate) Volume Variance due to activity (quantity) 2 Expected $$ @ Actual volume 1 Actual $$ 3 Budgeted $$ Budgeted Resource ($$ per unit resource) Activity Level Budgeted Volume Actual Volume
Full-absorption Overhead Variance Analysis Variance due to Price (rate) OH $$ Variance due to Volume (quantity) Actual Applied OH $$ 1 ALLOCATED OVERHEAD 2 Volume-adjusted OH $$ BUDGETED OVERHEAD Y=mx + b 3 Budgeted OH $$ Activity Level Actual Volume Budgeted Volume
Overhead Variances under Full-absorption Costing • Variation for Y = mx + b Where Y = applied overhead m = Variable Overhead rate (budgeted) x = actual quantity of overhead vehicle (i.e. hours) b = Fixed Overhead expenses (budgeted) 2 ACTUAL QUANTITY AT ACTUAL PRICE (ACTUALS) AQ x A P ACTUAL QUANTITY AT STANDARD PRICE Y = mx + b STANDARD QUANTITY AT STANDARD PRICE SQ x S P 1 2 3 1 – 2 = PRICE VARIANCE AQ(AP-SP) 2 – 3 = QUANTITY VARIANCE SP(AQ-SQ) TOTAL VARIANCE (1 - 2) + (2 - 3)