Download

1 / 4
40 likes | 48 Vues
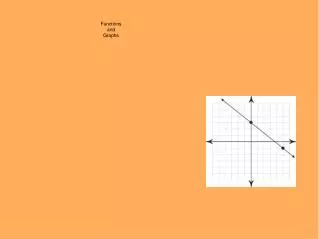
Functions and graphs. Sec 7 1-C pg. 385 - 389. Graphing functions. When graphing a function we can use a function table to generate points. Choose 4 points for values of x. Graph y = x – 1 Our ordered pairs are: (-4, -5), (-1, -2), (1, 0), (3, 2) Plot on the coordinate plane.

E N D
Functions and graphs Sec 7 1-C pg. 385 - 389
Graphing functions • When graphing a function we can use a function table to generate points. • Choose 4 points for values of x. • Graph y = x – 1 • Our ordered pairs are: (-4, -5), (-1, -2), (1, 0), (3, 2) • Plot on the coordinate plane. Once you have plotted the points, connect them with a line
Real World Example 40 • Jose is selling candles. Each candle cost $8.00. Write an equation for this relation and graph. • Let’s choose our Domain as {1, 2, 3, 4}. • Our range becomes {8, 16, 24, 32} • Ordered pairs are (1, 8), (2, 16), (3, 24), (4, 32) • Now graph 32 24 16 8 1 5 2 3 4
Graphing Functions • Graph y = -2x + 1 • Choose 4 points for values of x. D={-2, -1, 1, 2} • Graph y = -2x + 1 • x -2x + 1 y • -2 -2(-2) + 1 5 • -1 -2(-1) + 1 3 • 1 -2(1) + 1 -1 • 2 -2(2) + 1 -3 • Our ordered pairs are: (-2, 5), (-1, 3), (1, -1), (2, -3) • Plot on the coordinate plane.