Download
1 / 35
350 likes | 444 Vues
MAINE AND OZONE TRANSPORT REGION - OZONE NAAQS ISSUES - 2009 OZONE SEASON SUMMARY - OZONE AND PRECURSOR (PAMS) TRENDS February 25, 2010 MEDEP Monitoring Meeting. Tom Downs, CCM Chief Meteorologist Maine DEP-BAQ 17 State House Station Augusta, ME 04333-0017 TEL: 207-287-7026

E N D
MAINE AND OZONE TRANSPORT REGION- OZONE NAAQS ISSUES- 2009 OZONE SEASON SUMMARY - OZONE AND PRECURSOR (PAMS) TRENDSFebruary 25, 2010 MEDEP Monitoring Meeting Tom Downs, CCM Chief Meteorologist Maine DEP-BAQ 17 State House Station Augusta, ME 04333-0017 TEL: 207-287-7026 E-MAIL: tom.downs@maine.gov
1997 8-hour NAAQS 84 ppb Primary = secondary Entire state is designated ATTAINMENT with SIP maintenance plans in place Current SIP designations are only for the 1997 NAAQS 2008 8-hour NAAQS 75 ppb Primary = secondary EPA delayed designations until March 12, 2011 because of the ozone NAAQS reconsideration. If, as a result of the reconsideration, EPA issues different ozone standards in 2010, the new ozone standards would replace the 2008 ozone NAAQS and implementation requirements associated with the replaced 2008 ozone NAAQS, including area designations, would no longer apply. Instead, EPA would begin a new process to designate areas for the 2010 ozone NAAQS on an accelerated schedule. OZONE STANDARDS
OZONE NAAQS RECONSIDERATION • January 19, 2010 OZONE NAAQS proposal • primary 8-hour 60-70 ppb (new data handling conventions) • Secondary 7-15 ppm-hrs seasonal cumulative W126 index • August 2010 Final • January 2011 State designation recommendations • (Maine will use 2008-10 data) • July 2010 Final EPA designations • August 2011 designations become effective • August 2013 Infrastructure SIPS due? (3-yrs after promulgation) • December 2013 SIPS are due for nonattainment areas
Primary OZONE NAAQS 1/19/10 Primary Ozone NAAQS Reconsideration Proposal • Indicator – 8-hour Ozone averaging period • Level – 0.06 – 0.07 ppm • Form – annual 4th highest daily maximum 8-hour average concentration averaged over three years. • Data handling conventions (ppm) • 1-hour – truncate after the third decimal place • 8-hour – keep all digits • 6-8 hours used dividing by number of hours • 1-5 hrs used with missing data substitution scheme. • Use lowest Ozone concentration during the season for that hour • Outside of ozone season use ½ MDL • Design Value – round to three decimal places • Valid if data recovery rates for each ozone season is at least 75% or the Design Value is greater than the standard • Use all data available inside or outside of the Ozone Season. 3/27/08 Primary Ozone NAAQS • Indicator – 8-hour Ozone averaging period • Level – 0.075 ppm • Form – annual 4th highest daily maximum 8-hour average concentration averaged over three years • Data handling conventions (ppm) • 1-hour – truncate after the third decimal place • 8-hour – truncate after the third decimal place • 6-8 hours used dividing by number of hours • 1-5 hours no calculation made • Design Value – truncate after the third decimal place • Valid if 3-yr data recovery rate is at least 90% for the ozone seasons or the Design Value is greater than the standard
Secondary OZONE NAAQS 1/19/10 Secondary Ozone NAAQS Reconsideration Proposal • Indicator – maximum 3-month 8am -8pm cumulative W126 index • Level – 7 – 15 ppm-hrs • Form – three year average of the annual maximum consecutive 3-month sum of adjusted monthly W126 index values • Data handling convention (ppm-hrs) • Hourly W126 – keep all digits • Monthly W126 – keep all digits • Valid if the daylight hourly data recovery rate is at least 75% • If the daylight hourly data recovery rate is more than 75% or less than 100% then adjust the monthly W126 by the ratio of the number of possible reporting hours to the number of reported hourly concentrations. • Design Value – rounded to a whole number • Valid if the daylight hourly data recovery rate is at least 75% for each month in the required ozone monitoring season • If one or more month does not have 75% data recovery rate then the design value is still valid if the following substitution scheme results in a design value greater than the secondary standard. • Substitute the lowest hourly daylight ozone concentration in the required ozone season or ½ of the method detection limit of the monitor , whichever is higher, within each month to make the month 75% complete • Adjust for the remaining missing data using the ratio mentioned above. 3/27/08 Secondary Ozone NAAQS = Primary Ozone Standard
W126 INDEX To determine the W126 index, the sigmoidal weighting value at a specific concentration is multiplied by the concentration and then summed over all concentrations. The sigmoidal weighting function is of the form: • where: M and A are arbitrary positive constants • wi = weighting factor for concentration ci • ci = concentration i (in ppb) • The arbitrary positive constants M and A are 4403 and 126 ppm-1, respectively. Their values were subjectively determined to develop a weighting function that (1) focused on hourly average concentrations as low as 0.04 ppm, (2) had an inflection point near 0.065 ppm, and (3) had an equal weighting of 1 for hourly average concentrations at approximately 0.10 ppm and above. References • Lefohn A.S. and Runeckles V.C. (1987) Establishing a standard to protect vegetation - ozone exposure/dose considerations. Atmos. Environ. 21:561-568. • Lefohn A. S., Lawrence J. A. and Kohut R. J. (1988) A comparison of indices that describe the relationship between exposure to ozone and reduction in the yield of agricultural crops. Atmospheric Environment. 22:1229-1240.
2009 Ozone Season • Few ozone events for the 2nd season in a row • Only 3 exceedance days for the 75 ppb standard in Maine and 2 exceedances of the old 84 ppb standard • Meteorological conditions not conducive for ozone during June and July • Economy and control strategies (NOx SIP call fully implemented) lowering ozone precursor emissions
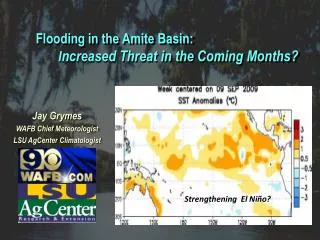
June-August Surface Temperature and Precipitation Anomaly Patterns
Below Normal Temperature – less conducive to ozone formation 12
Above Normal Precipitation – less conducive to ozone formation 13
2005-2009 June-August 850mb Height Anomalies NCEP/NCAR REANALYSIS Jun-Aug 2005 Jun-Aug 2006 Jun-Aug 2007 Below Normal Heights – more conducive to cloud formation thus less conducive to ozone formation Jun-Aug 2008 Jun-Aug 2009 15
2005-2009 June-August 850mb Temperature Anomalies NCEP/NCAR REANALYSIS Jun-Aug 2005 Jun-Aug 2006 Jun-Aug 2007 Below Normal Temperature – less conducive to ozone formation and transport Jun-Aug 2008 Jun-Aug 2009 16
2005 2006 2009 2007 2008
2005-07 DV 2006-08 DV Only 2 sites over the 1997 standard
The Coincident Economic Activity Index includes four indicators: nonfarm payroll employment, the unemployment rate, average hours worked in manufacturing and wages and salaries. The trend for each state's index is set to match the trend for gross state product.
2009 PAMS SITES IN THE OZONE TRANSPORT REGION Hourly VOC Data Available No hourly VOC data available as of Feb 24, 2010 Only 3-hr VOC data available Only 24-hr VOC data available PAMS SITES OTR-CORE
Summary • Meteorological Conditions were not conducive to ozone formation during the 2009 summer months • Conditions were also not conducive in 2008 • Only two monitoring sites in the OTR are violating the 1997 (84 ppb) Ozone NAAQS (using preliminary data) • OTC core, Western NY/PA and Northern New England high elevations have preliminary 07-09 DV’s > 75 ppb • All states have preliminary 07-09 DV’s > 70 ppb • Starting with two “clean” years for the 2008-10 DESIGN VALUES to be used for the next round of attainment/nonattainment designation recommendations. • Downward precursor emission and economic trends are also factoring into lower ozone concentrations
N/A-MAINTENANCE AREA SITES • Cadillac Mt. Summit (PAMS) • Kennebunkport • Cape Elizabeth (PAMS) • McFarland Hill • Durham • Gardiner • Port Clyde • West Buxton • Shapleigh • Bowdoinham (evaluate after 2010) • OZONE MAPPING & RURAL SITES • Jonesport • Holden • North Lovell • EPA CASTNET SITES • Howland • Ashland • TRIBAL SITES • Indian Island (Penobscot Nation) • Presque Isle (MicMac) • Sipayik (Passamaquoddy) • HEALTH STUDY SITE • Portland High elevation site for transport study and Secondary NAAQS? Best Downwind of Portland coastal site?