Download
1 / 31
310 likes | 398 Vues
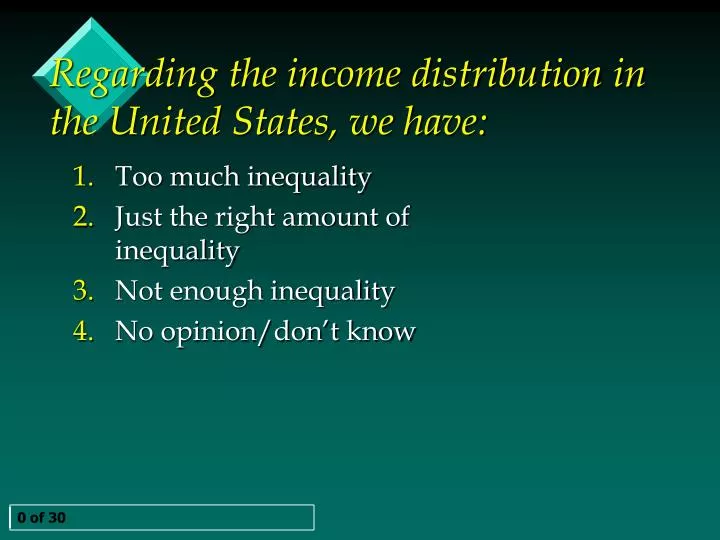
0 / 30. Regarding the income distribution in the United States, we have:. Too much inequality Just the right amount of inequality Not enough inequality No opinion/don’t know. Cross-Tab Label. 0 of 30. 0 / 30. Which do you prefer?. Every household earns exactly $40,000

E N D
0 / 30 Regarding the income distribution in the United States, we have: • Too much inequality • Just the right amount of inequality • Not enough inequality • No opinion/don’t know Cross-Tab Label 0 of 30
0 / 30 Which do you prefer? • Every household earns exactly $40,000 • 10% of the households each earns $40,000, the next 40% each earns $45,000, the next 40% earns $60,000, and the richest 10% earns $10,000,000. Cross-Tab Label 0 of 30
Unit 9 - Distribution of Wealth and Incomes • United States Income Distribution The United States Census Bureau measures the percentage of income each quintile (poorest to richest) earns as part of the total income. A quintile is 20% of the total. The table on the next slide provides the latest data for 2009 households and compares this with 2006 and 1979 data. Microeconomics
Unit 9 - Distribution of Wealth and Incomes • Percentage Distribution of U.S. Households, by Income Group, 2009, 2006 and 1979 (source: U.S. Census)
0 / 30 Are the rich getting richer, and the poor getting poorer? • Yes • No • It depends • Not sure Cross-Tab Label
Unit 9 - Distribution of Wealth and Incomes 50.3% 44% 4.2% 1979 This Year 3.4% Income distribution comparison by households
Unit 9 - Distribution of Wealth and Incomes • United States Income Distribution In absolute and relative terms, the rich are getting richer. In absolute terms (the size of the slice), the poor are getting richer, too. In relative terms (the percentage of the income), the poor are getting poorer. Microeconomics
0 / 30 Tracking studies that look at households over a 10 year time period indicate that what percentage of households moves into a higher quintile after 10 years? • 20% • 35% • 50% • 75% • 85% Cross-Tab Label 0 of 30
Unit 9 - Distribution of Wealth and Incomes • Income Inequality The Lorenz Curve (see next slide) shows the degree of income inequality. The straight 45-degree linerepresents perfect equality.The more the Lorenz Curvebows outward, the more income inequality exists. Microeconomics
Unit 9 - Distribution of Wealth and Incomes • Income Inequality – The Lorenz Curve Microeconomics
Unit 9 - Distribution of Wealth and Incomes • Income Inequality The Gini Coefficient is a ratio between 0 and 1. A coefficient of 0 means that the country has perfect income equality. A coefficient of 1 means that the country has perfect income inequality. The Gini Index is the coefficient expressed as a percentage. Microeconomics
Unit 9 - Distribution of Wealth and Incomes • Income Inequality What do you think the Gini coefficient should be? Is there too much income inequality in our country? The 2009 Gini coefficient for the United States was 44.3%; in 1988 it was 42.6%. Microeconomics
Unit 9 - Distribution of Wealth and Incomes • Income Equality Advantages of having income equality: • People who stress due to comparisons are happier. • Less use of natural resources and lower consumption. • More consumer satisfaction among the poor. • Greater political equalities. Microeconomics
Unit 9 - Distribution of Wealth and Incomes • Income Inequality Advantages of having income inequality: • Greater incentives to work hard. • Greater savings and investment. • More high-quality and innovative products. • More resources for the government and private citizens to help the needy. Microeconomics
Unit 9 - Distribution of Wealth and Incomes • Poverty The poverty line is an income amount below which households are considered poor. In the United States, a family of three persons (two parents and one child in all states except Alaska and Hawaii) was considered poor if it earned less than $17,552 in 2010. The poverty line increases each year along with increases in the cost of living.Source: http://www.census.gov/hhes/www/poverty/data/threshld/thresh09.html Microeconomics
Unit 9 - Distribution of Wealth and Incomes • Poverty In the U.S. the official poverty rate in 2009 was 14.3%. In 2008 it was 13.2%. In 2007, it was 12.5%. For detailed information about incomes and distribution across racial and demographic groups, visit:http://www.census.gov/hhes/www/poverty/data/index.html Microeconomics
Unit 9 - Distribution of Wealth and Incomes • Poverty Not all poverty causes can be eliminated. However, these actions have helped many people avoid poverty: • Live a healthy lifestyle. • Learn a trade. • Invest wisely. • Make sound relationship decisions. Microeconomics
Unit 9 - Distribution of Wealth and Incomes • Government Anti-poverty Programs Main programs in the United States include: • TANF (Temporary Aid For Needy Families – 4.4m; $22b) • Social Security • Medicare (Medical assistance for the elderly) • Medicaid (Medical assistance for the poor – 50m; $273b) • Unemployment Compensation (10m; $160b) • Food Stamps (40+m; $70b) • Housing Subsidies • Head Start • Earned Income Tax Credit • Job Training Programs Microeconomics
0 / 30 Should we reform welfare programs? • Yes, increase total spending • Yes, decrease total spending • No • Not sure Cross-Tab Label
Unit 9 - Distribution of Wealth and Incomes • Anti-Poverty Program Effectiveness How effective are government anti-poverty programs? How much do they cost? How much do they raise taxes?How much do they help the poor? Are people better off when they work, or when they are on welfare? Microeconomics
Unit 9 - Distribution of Wealth and Incomes • Government Poverty Program Alternatives There will always be a need to aid the less fortunate. The 1996 Welfare Reform Act has been a step in the right direction. Are there more effective ways to help the poor? Microeconomics
0 / 30 Should we cut back on government welfare programs and rely more on private charities to provide help to the poor? • Yes • No • Indifferent • Not sure Cross-Tab Label
Unit 9 - Distribution of Wealth and Incomes • Government Poverty Program Alternatives Advantages of private charities: • Decrease in taxes • Less government spending, less borrowing, lower inflation. • Higher incomes mean more giving to charities, especially if government is no longer responsible. • Volunteers are motivated to help; government welfare workers have possible conflict of interest. • Small, private charities have better information regarding the needs of the poor. Microeconomics
Unit 9 - Distribution of Wealth and Incomes • Government Poverty Program Alternatives Disadvantages of private charities: • No guarantees. • Decrease in giving during recessions. • More potential for discrimination? Microeconomics
Unit 9 - Distribution of Wealth and Incomes • Government Poverty Program Alternatives The negative income tax plan proposes an income level (for instance $18,000) above which an individual will pay taxes, but below which an individual would receive a government subsidy (a subsidy is a negative tax). The main advantage is that people will always receive more income as they earn more money on the job. Microeconomics
Unit 9 - Distribution of Wealth and Incomes • The Negative Income Tax Plan Microeconomics
Unit 9 - Distribution of Wealth and Incomes • Tax Systems We distinguish between three types of tax systems: • Progressive taxes • Proportional (flat) taxes • Regressive taxes Microeconomics
Unit 9 - Distribution of Wealth and Incomes • Progressive Taxes Higher income earners pay a higher marginal tax rate. Example: Individual Income Tax System. Microeconomics
Unit 9 - Distribution of Wealth and Incomes • Individual Income Tax System
Unit 9 - Distribution of Wealth and Incomes • Proportional Taxes Everyone pays the same percentage tax. Example: Social Security tax (up to a certain income amount). Microeconomics
Unit 9 - Distribution of Wealth and Incomes • Regressive Taxes Higher income earners pay a lower percentage tax as a percentage of their income. Example: state sales taxes Microeconomics