Download
1 / 49
490 likes | 638 Vues
2018 Annual Report to the IOOC on U.S. IOOS. U.S. IOOS 2018 Annual Report. IOOC Monthly Meeting March 11, 2019 | Carl Gouldman. Agenda.

E N D
U.S. IOOS 2018 Annual Report IOOC Monthly Meeting March 11, 2019 | Carl Gouldman
Agenda ICOOS act - “report annually to the Interagency Ocean Observing Committee on the accomplishments, operational needs, and performance of the System to contribute to the annual and long-term plans…” Approach - FY18 accomplishments - and FY19 look ahead Strategic vision, mission, and goals Portfolio updates and agency highlights IOOS Program office items
IOOS Strategic Plan Vision -Improve lives and livelihoods with ocean, coastal, and Great Lakes information Mission - To produce, integrate, and communicate high quality ocean, coastal and Great Lakes information that meets the safety, economic, and stewardship needs of the nation. Five Strategic Goals:Goal 1: Sustain long-term, high-quality observations of ocean, coastal, and Great Lakes environments to address local, regional and national needs. Goal 2: Deliver standardized, reliable, and accessible data. Goal 3: Support model predictions that address a wide range of user requirements. Goal 4: Provide integrated, user-driven products and tools. Goal 5: Increase the reach and effectiveness of IOOS through partnerships, stakeholder engagement, and Enterprise excellence. https://cdn.ioos.noaa.gov/media/2018/02/US-IOOS-Enterprise-Strategic-Plan_v101_secure.pdf 4
Marine Mammal Health Monitoring and Analysis Platform Health MAP vision: For everyone to observe spatial and temporal interactions among marine mammal health, ocean health, & human activities CY18 Activities and Accomplishments: Further development of a prototype data platform in the Gulf of Mexico (Gulf MAP) • Gulf Environmental Benefit Fund through NFWF Implementation of the standardized, basic and initial health data fields Development of a project plan for Health MAP infrastructure realization as part of projects under consideration for restoration. Partners: Updates available:https://www.mmc.gov/priority-topics/marine-mammal-health-and-strandings/
Ocean Observatories Initiative (OOI) NSF Awards Contract to WHOI to Lead OOI Program Management (Sept 2018) Community Tools available on the OOI website to examine the Axial Volcano Community Engagement • Early Career Workshops (Spring & Summer 2018) • Deep Ocean Observing Workshop (Aug 2018) • Cabeled Array Hackweek (Feb 2018) and OceanHackweek (Aug 2018)
EPA and Nutrient Sensors • Nutrient Sensor Action Challenge • Technology-accelerating water quality challenge for demonstrated use of nutrient pollution sensors • Stage II launched in March 2018 • Stage II results submitted Feb 2019 • Winners to be announced this Spring (April) • Challenging Nutrients Coalition • Held Nutrient Reduction Visioneering II Meeting in June 2018 • Working to foster new and bold ideas that address excess nutrients in our nation's waterways. • Evaluating Nutrient Sensor Operational Status • Alliance for Coastal Technologies (ACT) is assessing commercially available nutrient sensors deployed in the Gulf of Mexico and Long Island Sound.
Argo Program 2 Millionth Argo profile recorded! New Argo Float Testing • Deep Argo • Biogeochemical Argo Steve Piotrowicz memorial float deployed July 2018
2018 Arctic Report Card Released NOAA's Arctic Report Card (www.arctic.noaa.gov/Report-Card/) reflects on a range of land, ice, and ocean observations made throughout the Arctic during 2018 Highlights • Surface air temperatures continued to warm at twice the rate relative to the rest of the globe. • Atmospheric warming in the terrestrial system continued to drive broad, long-term trends • Herd populations of caribou and wild reindeer have declined by nearly 50% over the last two decades • Sea ice remained younger, thinner, and covered less area • Observations suggest long-term decline in coastal landfast sea ice • Spatial patterns of late summer sea surface temperatures are linked to regional variability • Considerably higher ocean primary productivity levels • Expansion of harmful toxic algal blooms • Microplastic contamination is on the rise
TPOS 2020 5th Steering Committee Meeting (SC-5) held November 2018 TPOS 2020 Projects: • Saildrone - four Saildrones launched in Oct 2018 from Honolulu, HI to begin six-month research mission. Testing new technology for improving weather forecasts. • Enhanced Moorings - aims to improve measurement of ocean surface boundary layer by deploying additional instrumentation on existing TAO moorings. • Pre-field modeling studies - NOAA's Climate Variability and Predictability program funded 8 pre-field modeling studies.
U.S. Glider Network FY18 (Increase to fill gaps +$2M) Deployments: Picket Line, HAB/Marine Mammal Monitoring, CalCOFI Lines, SAB Shelf work. Post-Doc: Model comparisons for hurricane intensity work DAC: Navy glider data made public, Improved QA/QC, IOOS $$ 7,047 Glider Days 137 Glider Deployments Navy Partnership: 30+ Gliders available to the nation. Navy gliders increased available ocean profile data 1,000 fold in USVI!! NOAA Navy MOU for glider support to hurricanes 2018-2023 FY19(Increase to fill gaps + $2.5M) International: “Best Practices” Workshop, Global Data Synchronization National: Glider coordination plan DAC: Support New Variables, Improve Data Flows Impact Assessments: Investigate glider data impacts on operational models 2018 “Picket Line” https://gliders.ioos.us/
U.S. Animal Telemetry Network (ATN) FY18 Accomplishments and Funding • Three Workshops:GCOOS, PACIOOS, West Coast (NANOOS/CeNCOOS/SCCOOS) • Transitioned ATN DAC from research environment to operational location - Axiom • Hired Data Coordinator to be the primary interface between telemetry community and ATN DAC; posted at CeNCOOS • Animal Telemetry Baseline infrastructure support: Two regional acoustic network Data Wranglers (FACT & ACT); Georgia Coastal Acoustic Receiver Array; Argos satellite fees payment program; Develop Next generation animal movement analysis tools; Satellite/Acoustic Telemetry Asset Inventory • $1.35M Total investment from ONR, BOEM, NOAA https://ioos.noaa.gov/project/atn/
U.S. Animal Telemetry Network (ATN) FY19 Plans and Funding • Greater stakeholder interaction and advocacy • Increase number of federal agencies supporting ATN and using DAC management capabilities for PARR compliance • Expand multi-agency collaborative baseline observations and infrastructure support • Expand and promote the use of animals as biological sensors • Innovative analytical and visualization tools & data products • Anticipated FY-19 total funds ~$1.45M Next Steps • Complete Workshop reports; Distill & combine all workshop conclusions into actionable items • Maintain strong collaboration with MBON to implement a sustained IOOS Bio-observing component
National Coastal Ecosystem Moorings FY18 Accomplishments • Workshop held March 2018 • Community of experts from academia, private industry, and federal agencies (NOAA, EPA, BOEM) • Produced recommendations to define coastal ecosystem moorings • Three-tiered mooring approach outlining levels of measuring requirements • Discussed best practices for mooring deployments, operations and maintenance • Report available: http://www.act-us.info/Download/Workshops/2018/Ecosystem_Mooring_Workshop_Report.pdf • FY19 Next Steps • OceanObs’19 - CWP (Coastal Mooring Observing Networks and their Data Products: Recommendations for the Next Decade) and engagement with community to continue dialogue on moorings
U.S. Marine Biodiversity Observation Network (MBON) FY18 Accomplishments and Funding • eDNA best practices and demonstrations, including in AUVs • MBON remote sensing-based seascapes products launched at CoastWatch • Ongoing development of applications and ‘infographics’ for National Marine Sanctuary managers and regional Integrated Ecosystem Assessment (IEA) teams • $2.7M total investment from NOAA, NASA and BOEM FY19 Plans and Funding • New projects to be announced in Summer 2019 • Partnership with NOAA, NASA, BOEM + new partner ONR; working towards a unified MBON-ATN and joint FFO in FY22 • Anticipate $1.5-2M per year for multiple projects • Oceanography special issue: MBON methods & technology
Program Office Highlights and Priorities Highlights and Priorities • FY19 Plans • Budget info • Certification • Observing and Data Management • QARTOD • HABs • Modeling • Implementation Next 10 Years
FY2019 IOOS PO Highlights IOOS Advisory Committee - new members and new chair NOAA Weather Act – weather and water prediction Blue Economy – innovationis boosting our blue economy Modeling: through COMT - Revolutionize Water Modeling, Forecasting, and Prediction – Wx Act 2017 = NOAA priority! IOOS in key role for community approaches. Ocean Technology Transition – 2 new projects – geographic balance – late summer 2019 for next FFO for award in FY2020 IOOS partnering and leveraging – Ocean Acidification Program, Marine Biodiversity Observation Network, Animal Telemetry Network, National Weather Service, National Ocean Service, Regional Ocean Partnerships Filling IOOS gaps • FY19 $7.5M gap filling ICOOS Act reauthorization 17
Ocean Technology Transition Program FY18 ($2.5M) 3 ongoing projects • Lake Erie HABs/Hypoxia (GLOS) • West Coast HABs (UCSC/ SCCOOS/CeNCOOS) • Gulf of Maine Lobster Industry (NERACOOS) 2 new projects • MARACOOS/U of Delaware [Data Integration and Web-based Model Validation Tool for NOAA CO-OPS] • U of Notre Dame [Building Coupled Storm Surge and Wave Operational Forecasting Capacity for Western Alaska] Bio data pilot ‘seed’ projects Submaran ASV/UUV deployment FY19 (~$2.75M) 4 ongoing projects & new call for proposals • Lake Erie HABs/Hypoxia, • West Coast HABs • MARACOOS/U of Del, • U of Notre Dame/Alaska https://ioos.noaa.gov/project/ocean-technology-transition/
U.S. IOOS Enacted and President’s Budgets FY04-19 NOAA National Ocean Service • Navigation, Observations, and Positioning: ‘National IOOS’ component FY19 Omnibus $6.8M & ‘Regional IOOS Observations’ $38.5M ($1.5M for Reg.Oc Prtnrships) • Estimated Enacted levels are ‘post rescission’ totals for each year • ‘Request’ = the President’s Budget Request 19
U.S. IOOS FY18 partner funding totals • Funds from partners either process through the IOOS Office, or funded to projects by IOOS partner agencies (e.g. MBON projects through the NOPP) ACT = Alliance for Coastal Technologies, ATN = Animal Telemetry Network, COMT = Coastal and Ocean Modeling Testbed, DMAC = Data Management and Communications, MBON = Marine Biodiversity Observation Network, OAP = Ocean Acidifcation Program, OTT = Ocean Technology Transition, RCOOS = IOOS RAs coastal ocean observing system 21
Integrated Coastal and Ocean Observation System Act of 2009 (ICOOS Act) IOOC defined high level criteria Conveys formal recognition of IOOS Regional Associations Extends civil liabilitycoverage for data use Establish minimum criteria for how a RICE operates Adherence to data management best practices Enhance delivery and quality of data and information All 11 IOOS Regions are now certified! (Aug 2018) Re-certification of regions will begin in 2020 Program Office developing process for recertification Certification of all non-federal IOOS Regions 22
Flow to the GTS across the IOOS Enterprise Sum of in situ obs delivered over CY2018: 71,211,630 All observations from NDBC + non-NDBC partner + IOOS-regional. Does not include HF Radar, Gliders. Does not include water level or biogeochemical data
HF Radar Network Development Filling gaps - new radars in FY18 • 2 in Alaska • 4 in Southeast • Site selection for FY17 funded 4 radars in Gulf of Mexico and Pacific Northwest • FY19 • New Restore Act funds ‘Gulf Loop Current Study’ - 7 new sites LA/MS, Mexico, FL straights • 5 New sites in 3 IOOS regions • Pacific Islands • Northeast • Caribbean https://ioos.noaa.gov/project/hf-radar/
National DMAC FY18 ($1.4M - National DMAC) Progress toward IOOS-wide common ERDDAP implementation - simpler and more approachable interface to access IOOS data OceanObs’19 Community Whitepapers: • Cloud Computing, Global Data Interoperability, Coastal Moorings, Global BioDiversity Observations, Quality Assurance Vision Community Building, Training, and Technical Outreach Efforts: • IOOS Biological Data Training #1, Seattle, WA February 2018 • Planning for IOOS Code Sprint #1 (to be held in Ann Arbor, MI October 2019) • IOOS Data Demo Center: making IOOS data & services accessible and usable Held DMAC Annual Meeting with 95% positive feedback (e.g. ‘One of the best DMAC meetings to date’)
QARTOD FY18 QARTOD manuals completed and published to ioos.noaa.gov: • New Stream Flow Manual (Sept 2018) • Update to Dissolved Nutrients manual (Feb 2018) • Update to Dissolved Oxygen manual (Aug 2018) FY19 QARTOD manuals planned/completed: • Update to in-situ surface waves manual. Completed/published Feb 2019 • New QA Manual, development in partnership with AtlantOS, ACT, JCOMM • In review with Frontiers in Marine Science research topic Best Practices in Ocean Observing. If accepted, will be published in Frontiers and published to ioos.noaa.gov. • New pH manual. Est complete by Aug 2019 • Update to in-situ currents manual. Est complete by August 2019 All manuals are included in the Ocean Best Practices repository. https://ioos.noaa.gov/project/qartod/
HAB forecasting ‘system’ GCOOS new exp. respiratory forecast for Pinellas county FL https://gcoos.org/red-tide-forecast/
Modeling Advancements NOAA Water Initiative • New product development National Ocean Service Modeling Portfolio Manager EDS Model Viewer Advancements IOOS Coastal & Ocean Modeling Testbed Ocean Modeling Sandbox and Cloud Computing
IOOS Implementation IOOS Office Annual Guidance Memo AGM - planning process March-May Seeking IOOC input! Ocean Technology Transition Governing plans and documents: DMAC Plans Coastal Moorings Strategy Waves Plan HF Radar/Surface Currents Plan Coastal Modeling Strategy - (IOOC TT Report published in Journal of Operational Oceanography) NOAA Water Initiative - https://www.noaa.gov/water/ ATN Implementation Plan (2016-2021) Toward a US IOOS Underwater Glider Network Plan NOAA’s Ecological Forecasting Roadmap QARTOD Project Plan (2017-2021) NOAA ‘Omics Roadmap(2019 draft out very soon) Noise • NOAA Ocean Noise Strategy Roadmap https://cetsound.noaa.gov/road-map • OST TF on Ocean Noise and Marine Life draft work plan
Looking forward Connecting Global and Coastal observations OceanObs’19 - Regional - Coastal - Global Essential Ocean Variables and Communities of Practice development UN Decade of Ocean Science for Sustainable Development OSTP’s Science and Tech for Oceans: A Decadal Vision
NATIONAL COASTAL ECOSYSTEM MOORINGS WORKSHOP University of Washington March 20 - 21, 2018
U.S. IOOS Enacted and President’s Budgets FY15-19 NOAA National Ocean Service • Navigation, Observations, and Positioning: ‘National IOOS’ component FY19 Omnibus $6.8M & ‘Regional IOOS Observations’ $38.5M ($1.5M for Reg.Oc Prtnrships) • Estimated Enacted levels are ‘post rescission’ totals for each year • ‘Request’ = the President’s Budget Request 33
U.S. IOOS: Program Timeline 1990s – US ocean observing community planning for IOOS 2000-2001 Navy, NASA, NSF, NOAA (4 “Ns) EPA, USCG, USACOE, et. al Signing MOU to establish Ocean.US 2002 - IOOS planning Summit – “aka Airlie House Report” 2004 - Pew and US Commissions on Ocean Policy &First US IOOS Development Plan 2006 – NOAA IOOS Office and program established 2008 & 2009 – “IOOS” in President’s Budget & ICOOS Act passes PL 111-11 2012 – US IOOS Summit 2018 – US IOOS Enterprise Strategic Plan 2019 – Ocean Obs ‘19 global and coastal observing coming together 2021-30 - UN Decade of Ocean Science
IOOS refreshed Core Variables PHYSICS • Bathymetry • Bottom character • Currents • Heat flux • Ice distribution • Salinity • Sea level • Surface waves • Stream flow • Temperature • Wind speed and direction BIOGEOCHEMISTRY • Acidity • Colored dissolved organic matter • Contaminants • Dissolved nutrients • Dissolved Oxygen • Ocean color • Optical properties • Pathogens • Partial pressure of CO2 • Total suspended matter BIOLOGY & ECOSYSTEMS • Biological vital rates • Coral species and abundance • Fish species/abundance • Invertebrate species and abundance • Marine mammal species/abundance • Microbial species/abundance/activity • Nekton diet • Phytoplankton species/abundance • Sea birds species/abundance • Sea turtles species/abundance • Submerged aquatic vegetation species/abundance • Sound • Zooplankton species/abundance https://cdn.ioos.noaa.gov/media/2018/02/US-IOOS-Enterprise-Strategic-Plan_v101_secure.pdf 36
Growing Navy Collaboration - Navy Glider Operations Largest Glider Fleet in the world. Used to collect oceanographic data in data deprived environments. Data is being assimilated into operational ocean models. 100 simultaneous glider milestone reached. 37
NAVOCEANO Support for Hurricane Gliders 2018 Tropical Atlantic Hurricane Gliders Puerto Rico 4 NOAA/AOML 5 NAVOCEANO USVI 5 NACOCEANO 38
Delivering Observations: Environmental Sensor Map • Integrates regional, national, and global real-time data (past 4 hours) across the IOOS enterprise – federal and nonfederal sources. (~40,000 stations, 120,000 sensors) Hexagonal bins provide data summary, ease visualization and load time Choose base layer, units Dynamic graphs of values at a location. FY2018 • ERDDAP server for access to underlying data • Customized “data views” for events or themes • 4-D data views • Optimized searches 19 sensors.ioos.us
Regional applications of integrated observations West Coast HABs Lake Erie HAB/hypoxia Gulf of Maine lobster industry • Drinking water impacts • Subsurface observations from GLOS/GLERL buoys • Informs municipal water districts/intake managers • Maine’s largest commercial fishery • NERACOOS buoys: only source of real-time subsurface water temperatures • Forecast start date of lobster fishery to optimize the harvest • Emergency closures of crab fisheries • Environmental Sample Processor (new technology) used to detect toxins • HAB bulletins, forecasts vital to shellfish growers, fishermen, marine mammal rescue groups “We receive valuable and complex information in real time with these buoys. That data is an important addition to our treatment tool kit.” - City of Cleveland Water Dept Photo credit: Stephanie Moore Map: CeNCOOS/SCCOOS Image: Gulf of Maine Research Institute Photo credit (left): Brad Woolhiser Lower photo credit: Dave Zapotosky
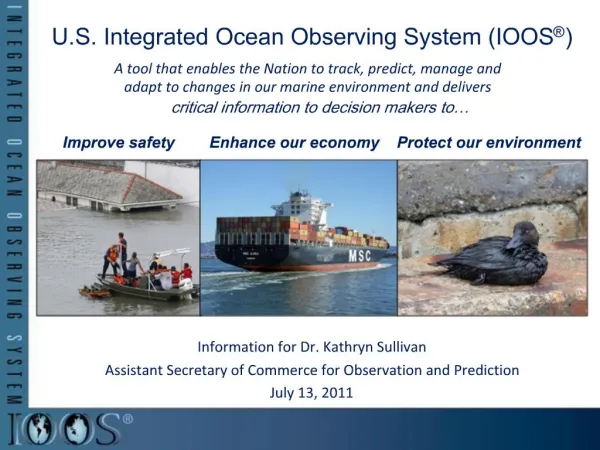
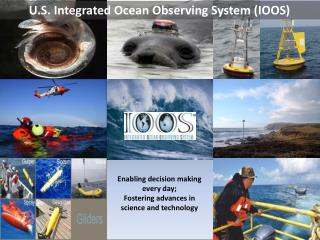
What is U.S. IOOS? U.S. IOOS is a cooperative, coordinated network of federal and non-federal observing networks. • Thousands of gigabytes of observing data are gathered every day by agencies, researchers, and others in the process of meeting their own missions and goals. • Before U.S. IOOS, there was no coordinating body to oversee the integration and open availability of those data. • U.S. IOOS works across and with regional, national, and international entities to gather, integrate, and disseminate that data in service of our seven societal goals. • U.S. IOOS takes a leadership role in ensuring that observing infrastructure is operated and maintained in pace with current technology and in service of stakeholder needs. 41
Flow to the GTS: CY2018 https://www.ndbc.noaa.gov/ioosstats/ IOOS Stations = RA-owned + RA partners. Nonfederal stations served through RA portals. NDBC Stations = Coastal Weather Buoys + CMAN non-NDBC Partner Stations = Other federal: NOS (CO-OPS), CBIBS, GLERL, ICON, EPA, NERRS, NWS Regional, NPS, OOI, USACE. Other nonfederal: Scripps, Everglades National Park # observations by category # stations by category (Future effort: lump/split differently to show federal vs nonfederal)
MBON Tools @ mbon.ioos.us MBON Data portal Infographics MBON Curated Data Views Audience: Scientists, technical experts Audience: public, managers, educators Audience: Advisory groups, researchers, teams
MBON User Needs to Date BOEM: Environmental Studies Program long term monitoring Products to support platform decommissioning in California, oil and gas development in the Arctic MBON Portal to search/download data in a region of interest States: Screening tools for toxic algae (eDNA - Florida) Data for ecosystem-based management (eg forage species, environmental conditions) Sanctuaries: Web-enabled updates to ONMS condition reports Data products for outreach and management Early warning of anomalous conditions IEA: Web-enabled updates into IEA conceptual models
Early warning and alert system for Sanctuaries Detection of anomalies in CHL, SST, Turbidity FGBNMS, FKNMS, others Dashboard and email alerts in real time Stetson Bank Anomaly detection
MBON Seascapes: Global, regional, operational • Classification of dynamic seascapes from satellite variables: SST, chl-a, SSS, tau, SSH, nFLH, CDOM • Soon to be produced operationally by NOAA/CoastWatch, NASA COVERAGE • Local to global • Applications for cruise planning, feature tracking • Also fisheries management, OA, HABS, characterizing Arctic habitat 46
US MBON and eDNA MBON is developing and testing eDNA methods to scope potential for operations Comparing results across trophic levels, regions, and time scales Peer-reviewed, documented best practices and methods MBON eDNA efforts are helping: • Florida improve screening for toxic algae, • Monterey Bay partners assess vertebrate diversity at oceanographic stations, and • Flower Garden Banks scientists detect diversity of corals, sponges, and brittle stars from spawning events.
Submaran deployment for HAB sampling Submaran being deployed to test as a platform for taking water samples for HAB organisms Submaran S-10 is a wind and solar-powered surface/subsurface vehicle Joint NANOOS, APL, NMFS. and OceanAero project 3 days of cruises - 9/25 - 9/27 - from Neah Bay, WA Collecting water samples and associated metocean data Samples to be analyzed at the Makah tribal lab. X
THREE ATN COMPONENTS • BUILD ALLIANCES AND COLLABORATIONS • PROVIDE TELEMETRY DATA MANAGEMENT & DELIVERY WITH AN OPERATIONAL DAC • SUPPORT STAKEHOLDER BASELINE ANIMAL TELEMETRY OBSERVATIONS ACT