Download
1 / 7
70 likes | 179 Vues
Millers Rainwater Project. Briarcliff Raingarden. After. Before. Plymouth Pond. After. Before. Storm Comparison #1: Hydrographs. 2003. Total Rain: 0.6 inches in 2 hours prior to highest flow 1 inches total of rain received on April 4. Note: plymouth transducer was offline.

E N D
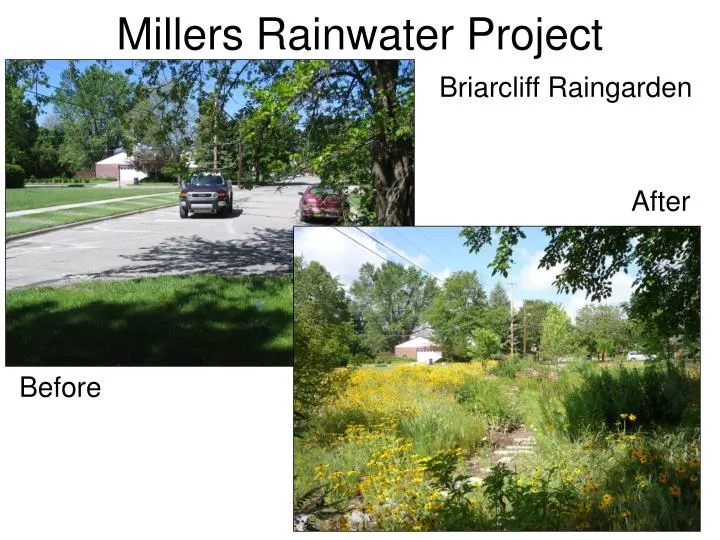
Millers Rainwater Project Briarcliff Raingarden After Before
Plymouth Pond After Before
Storm Comparison #1: Hydrographs 2003 Total Rain: 0.6 inches in 2 hours prior to highest flow 1 inches total of rain received on April 4 Note: plymouth transducer was offline Total Rain: 0.62 inches in 2 hours prior to highest flow 0.97 inches total of rain received on May 11-May 13. 2010 Prior moisture conditions: In 2003, off and on rains occurred throughout the day of the storm. In 2010, off and on rain occurred throughout 2 days prior to the storm. Both years had substantial rains 6 days prior to dates shown on graph.
Watershed size: 1.519 mi2 Storm Comparison #1: Water Calculations for Glazier Way study site April 4, 2003 May 13, 2010 • Inches of rain during storm:0.62 inches • Total amount of rain:2,188,216 ft3 • Percent of rain leaving system via stream: :52% (1,131,702 ft3) • Percent of rain trapped in BMPs, soil, plants, ponds, or evaporated: • 48% (1,056,514 ft3) • Percent of rain trapped in 75 rainbarrels (assuming they fill completely):0.03% (602 ft3) • Percent of rain absorbed by Thurston Elementary Raingarden:0.01% (191 ft3) • Percent of rain absorbed by Briarcliff Raingarden:0.10% (2,118 ft3) • Peak Flow: 131 cfs • Time from peak rain to peak flow: • 1 hour, 20 min • Rate of flow increase, once flow started to increase: • Approx 1 cfs/ min • Length of time it takes to return to pre-storm flow: • 43 hours 28 min • Rate of flow decrease for 2 hours after peak flow: • Approx 0.7 cfs/min • Inches of rain during storm: 0.70 inches • Total amount of rain:2,470,258 ft3 • Percent of rain leaving system via stream: • 43% (1,064,717 ft3) • Percent of rain trapped in soil, plants, ponds, or evaporated: • 57% (1,405,541 ft3) • Peak Flow:184 cfs • Time from peak rain to peak flow:5 min • Rate of flow increase, once flow started to increase: • Approx 1.5 cfs/min • Length of time it takes to return to pre-storm flow: • 14 hours 6 min • Rate of flow decrease for 2 hours after peak flow: • Approx 1.3 cfs/min
Storm Comparison #2: Hydrographs Total Rain: 0.4 inches in 2 hours (plus an additional 0.1 inches earlier in the day) 2003 Total Rain #1 : 0.5 inches mostly within 2 hours Peak Flow: 42 cfs Time from peak rain to peak flow: 2 hours Total Rain #2 : 0.42 inches mostly within 1 hours Peak Flow: 49 cfs Time from peak rain to peak flow: 1 hr, 24 min 2010 Prior moisture conditions: 2003 had only minor precipitation throughout March. 2010 had a major storm (about 1 inch rain) five days prior to dates shown on graph.
Watershed size: 1.519 mi2 Storm Comparison #2: Water Calculations for Glazier Way study site March 20, 2003 May 7, 2010 (note: these numbers are for the second peak, indicating pre-existing wet conditions • Inches of rain during storm:0.42 inches • Total amount of rain:1,482,155 ft3 • Percent of rain leaving system via stream: :Difficult to determine w/ 2 rain peaks • Percent of rain trapped in BMPs, soil, plants, ponds, or evaporated: • Difficult to determine w/ 2 rain peaks • Peak Flow: 49 cfs • Time from peak rain to peak flow: • 1 hour, 24 min • Rate of flow increase, once flow started to increase: • Approx 0.61 cfs/ min • Length of time it takes to return to pre-storm (peak 1) flow: • 48 hours • Rate of flow decrease for 2 hours after peak flow: • Approx 0.26 cfs/min • Inches of rain during storm: 0.4 inches • Total amount of rain:1,411,576 ft3 • Percent of rain leaving system via stream: • 29% (414,465 ft3) • Percent of rain trapped in soil, plants, ponds, or evaporated: • 71% (997, 111 ft3) • Peak Flow:82 cfs • Time from peak rain to peak flow:19 min • Rate of flow increase, once flow started to increase: • Approx 1.1 cfs/min • Length of time it takes to return to pre-storm flow: • 48 hours • Rate of flow decrease for 2 hours after peak flow: • Approx 0.6 cfs/min
Storm Comparison #3: Hydrographs Total Rain: 0.4 inches in 3 hours (first peak only) with 0.2 inches in 1 hour 2003 Total Rain: 0.40 inches in 5 hours (first peak only) With 0.19 inches in 1 hour. 2010