Download
1 / 1
10 likes | 138 Vues
Extreme soft X-ray emission from the broad-line quasar REJ2248-511 R.L.C. Starling 1* , E.M. Puchnarewicz 1 , K.O. Mason 1 & E. Romero-Colmenero 2 1 Mullard Space Science Laboratory, University College London, Dorking, Surrey RH5 6NT, UK.

E N D
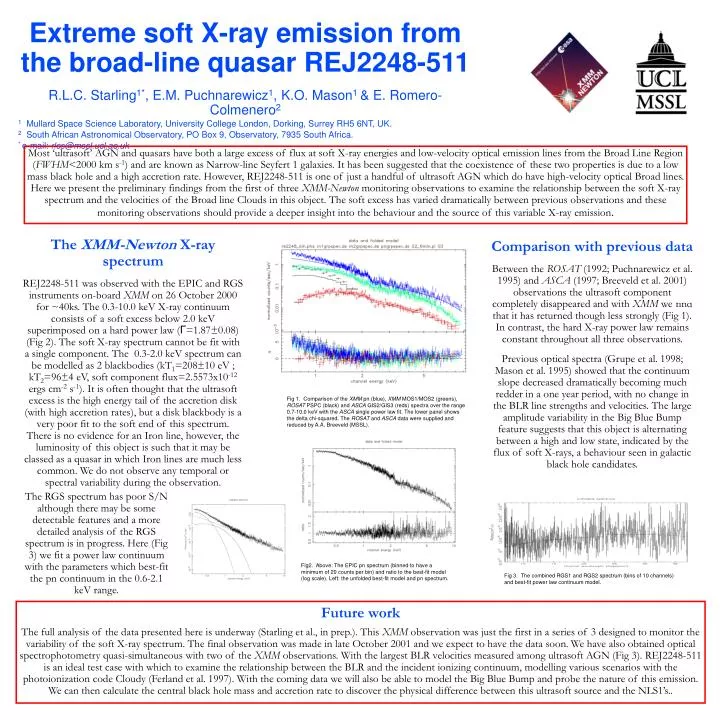
Extreme soft X-ray emission from the broad-line quasar REJ2248-511 R.L.C. Starling1*, E.M. Puchnarewicz1, K.O. Mason1 & E. Romero-Colmenero2 1 Mullard Space Science Laboratory, University College London, Dorking, Surrey RH5 6NT, UK. 2 South African Astronomical Observatory, PO Box 9, Observatory, 7935 South Africa. * e-mail: rlcs@mssl.ucl.ac.uk Most ‘ultrasoft’ AGN and quasars have both a large excess of flux at soft X-ray energies and low-velocity optical emission lines from the Broad Line Region (FWHM<2000 km s-1) and are known as Narrow-line Seyfert 1 galaxies. It has been suggested that the coexistence of these two properties is due to a low mass black hole and a high accretion rate. However, REJ2248-511 is one of just a handful of ultrasoft AGN which do have high-velocity optical Broad lines. Here we present the preliminary findings from the first of three XMM-Newton monitoring observations to examine the relationship between the soft X-ray spectrum and the velocities of the Broad line Clouds in this object. The soft excess has varied dramatically between previous observations and these monitoring observations should provide a deeper insight into the behaviour and the source of this variable X-ray emission. Comparison with previous data Between the ROSAT (1992; Puchnarewicz et al. 1995) and ASCA (1997; Breeveld et al. 2001) observations the ultrasoft component completely disappeared and with XMM we find that it has returned though less strongly (Fig 1). In contrast, the hard X-ray power law remains constant throughout all three observations. Previous optical spectra (Grupe et al. 1998; Mason et al. 1995) showed that the continuum slope decreased dramatically becoming much redder in a one year period, with no change in the BLR line strengths and velocities. The large amplitude variability in the Big Blue Bump feature suggests that this object is alternating between a high and low state, indicated by the flux of soft X-rays, a behaviour seen in galactic black hole candidates. The XMM-Newton X-ray spectrum REJ2248-511 was observed with the EPIC and RGS instruments on-board XMM on 26 October 2000 for ~40ks. The 0.3-10.0 keV X-ray continuum consists of a soft excess below 2.0 keV superimposed on a hard power law (Γ=1.87±0.08) (Fig 2). The soft X-ray spectrum cannot be fit with a single component. The 0.3-2.0 keV spectrum can be modelled as 2 blackbodies (kT1=208±10 eV ; kT2=96±4 eV, soft component flux=2.5573x10⁻¹² ergs cm-2 s-1). It is often thought that the ultrasoft excess is the high energy tail of the accretion disk (with high accretion rates), but a disk blackbody is a very poor fit to the soft end of this spectrum. There is no evidence for an Iron line, however, the luminosity of this object is such that it may be classed as a quasar in which Iron lines are much less common. We do not observe any temporal or spectral variability during the observation. Fig 1. Comparison of the XMM pn (blue), XMM MOS1/MOS2 (greens), ROSAT PSPC (black) and ASCA GIS2/GIS3 (reds) spectra over the range 0.7-10.0 keV with the ASCA single power law fit. The lower panel shows the delta chi-squared. The ROSAT and ASCA data were supplied and reduced by A.A. Breeveld (MSSL). The RGS spectrum has poor S/N although there may be some detectable features and a more detailed analysis of the RGS spectrum is in progress. Here (Fig 3) we fit a power law continuum with the parameters which best-fit the pn continuum in the 0.6-2.1 keV range. Fig2. Above: The EPIC pn spectrum (binned to have a minimum of 20 counts per bin) and ratio to the best-fit model (log scale). Left: the unfolded best-fit model and pn spectrum. Fig 3. The combined RGS1 and RGS2 spectrum (bins of 10 channels) and best-fit power law continuum model. Future work The full analysis of the data presented here is underway (Starling et al., in prep.). This XMM observation was just the first in a series of 3 designed to monitor the variability of the soft X-ray spectrum. The final observation was made in late October 2001 and we expect to have the data soon. We have also obtained optical spectrophotometry quasi-simultaneous with two of the XMM observations. With the largest BLR velocities measured among ultrasoft AGN (Fig 3). REJ2248-511 is an ideal test case with which to examine the relationship between the BLR and the incident ionizing continuum, modelling various scenarios with the photoionization code Cloudy (Ferland et al. 1997). With the coming data we will also be able to model the Big Blue Bump and probe the nature of this emission. We can then calculate the central black hole mass and accretion rate to discover the physical difference between this ultrasoft source and the NLS1’s..