1 / 1

Figure S1

Figure S1. sample 1: E+/L-. sample 2: E+/L+. sample 3: E-/L-. sample 4 : E-/L +.

kim
Télécharger la présentation

Figure S1

An Image/Link below is provided (as is) to download presentation Download Policy: Content on the Website is provided to you AS IS for your information and personal use and may not be sold / licensed / shared on other websites without getting consent from its author. Content is provided to you AS IS for your information and personal use only. Download presentation by click this link. While downloading, if for some reason you are not able to download a presentation, the publisher may have deleted the file from their server. During download, if you can't get a presentation, the file might be deleted by the publisher.

E N D

Presentation Transcript


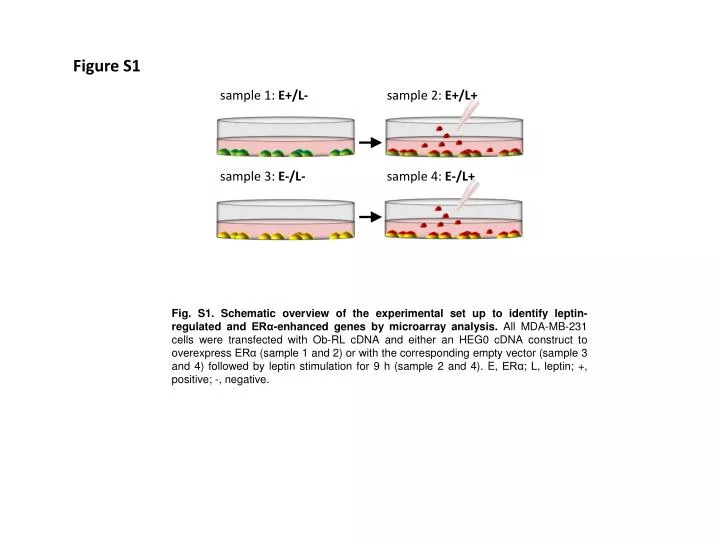
  1. Figure S1 sample 1: E+/L- sample 2: E+/L+ sample 3: E-/L- sample 4: E-/L+ Fig. S1. Schematic overview of the experimental set up to identify leptin-regulated and ERα-enhanced genes by microarray analysis. All MDA-MB-231 cells were transfected with Ob-RL cDNA and either an HEG0 cDNA construct tooverexpress ERα (sample 1 and 2) or with the corresponding empty vector (sample 3 and 4) followed by leptin stimulation for9 h (sample 2 and 4). E, ERα; L, leptin; +, positive; -, negative.

More Related