Download
1 / 1
10 likes | 117 Vues
Long term climate, hydrology & management Climate station network.

E N D
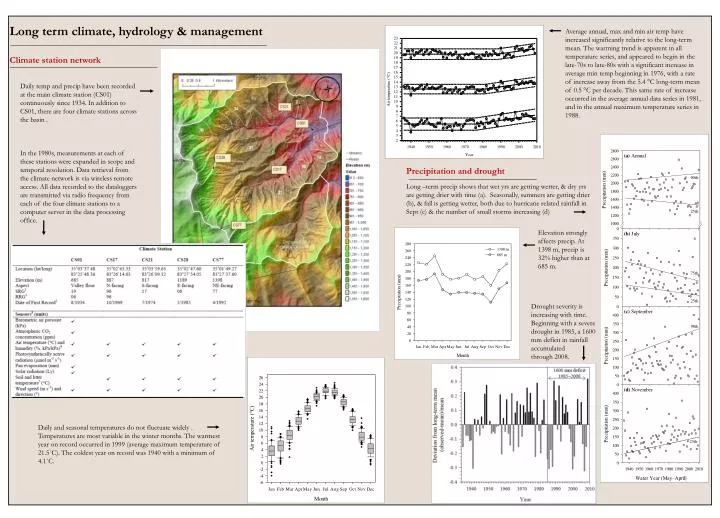
Long term climate, hydrology & management • Climate station network Average annual, max and min air temp have increased significantly relative to the long-term mean. The warming trend is apparent in all temperature series, and appeared to begin in the late-70s to late-80swith a significant increase in average min temp beginning in 1976, with a rate of increase away from the 5.4 °C long-term mean of 0.5 °C per decade. This same rate of increase occurred in the average annual data series in 1981, and in the annual maximum temperature series in 1988. Daily temp and preciphave been recorded at the main climate station (CS01) continuously since 1934. In addition to CS01, there are four climate stations across the basin . In the 1980s, measurements at each of these stations were expanded in scope and temporal resolution. Data retrieval from the climate network is via wireless remote access. All data recorded to the dataloggersare transmitted via radio frequency from each of the four climate stations to a computer server in the data processing office. Precipitation and drought Long –term precip shows that wet yrs are getting wetter, & dry yrs are getting drier with time (a). Seasonally, summers are getting drier (b), & fall is getting wetter, both due to hurricane related rainfall in Sept (c) & the number of small storms increasing (d) Elevation strongly affects precip. At 1398 m, precip is 32% higher than at 685 m. Drought severity is increasing with time. Beginning with a severe drought in 1985, a 1600 mm deficit in rainfall accumulated through 2008. Daily and seasonal temperatures do not fluctuate widely . Temperatures are most variable in the winter months. The warmest year on record occurred in 1999 (average maximum temperature of 21.5˚C). The coldest year on record was 1940 with a minimum of 4.1˚C.