Download

1 / 32
320 likes | 439 Vues
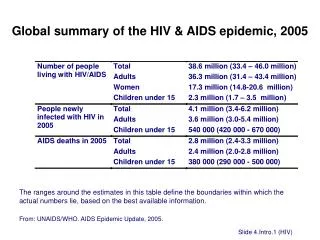
XVI International AIDS Conference Toronto HIV Epidemiology Update based on Plenary Presentation C hris Beyrer MD, MPH Johns Hopkins Bloomberg School of Public Health. % HIV prevalence, adult (15-49 ). Global HIV epidemic, 1990‒2005. Number of people living with HIV (millions).

E N D
XVI International AIDS ConferenceTorontoHIV Epidemiology Update based on Plenary PresentationChris Beyrer MD, MPHJohns Hopkins Bloomberg School of Public Health
% HIV prevalence, adult (15-49) Global HIV epidemic, 1990‒2005 Number of people living with HIV (millions) % HIV prevalence, adult (15‒49) • 38.6 million living with HIV [33 to 46 million] • 24.5 million in SS Africa • [21.6 to 27.4 million] 50 5.0 40 4.0 30 3.0 20 2.0 10 1.0 0 0.0 1990 1995 2000 2005 Number of people living with HIV Bar indicates the range around the estimate Source: UNAIDS 2006
IMPORTANCE OF PREVENTION (estimates 2005) 4.9 million new HIV infections 40.3 million people living with HIV/AIDS In 06/2006 1.65million onART 3.1 million AIDS related Deaths
Prevalence main determinant of incidence 4.9 million New HIV infections 40 million People living with HIV/AIDS 3.1 million AIDS related deaths
A global view of HIV infection, 2005 1.5 million 200,000 in ‘05 IDU 7.6 million 830,000 in ‘05 Heterosexual MSM IDU 12.1 million 1.3 million in ‘05 Heterosexual Source: UNAIDS 2006 Report on the Global AIDS Pandemic
Belarus Estonia Kazakhstan Russia Ukraine Serbia & Montenegro Iran Nepal Indonesia Libya Mauritius Kenya, Tanzania, Ghana, Nigeria** Burma China India Malaysia Thailand Vietnam Italy Netherlands Portugal Spain Argentina Brazil Uruguay Canada Puerto Rico USA States with at least one site with HIV prevalence > 20% in IDU in 2006 Emergent Epidemics Established Epidemics **African States with at least one published report of IDU risks Adapted from : Aceijas, et al, AIDS 2004 18:2295-2302
Individual Level Determinants for Parenteral HIV Infection Needle sharing Higher frequency of injection Cocaine injection Lack of opioid analogue therapy MSM-IDU history Injection use while incarcerated
120 000 105 000 90 000 75 000 60 000 45 000 30 000 15 000 0 Reported HIV cases in the Russian Federation and Ukraine, 1987–2005 Reported HIV cases in the Russian Federation Reported HIV cases in Ukraine 400 000 Russian Federation 350 000 Newly reported cases 300 000 Cumulative (previous years) 250 000 Ukraine 200 000 Newly reported cases 150 000 Cumulative 100 000 50 000 0 1987 1989 1991 1993 1995 1997 1999 2001 2003 2005 Adapted from : Russian Federal AIDS Centre; Ukranian AIDS Centre and Ministry of Health of Ukraine, UNAIDS 2006 Report on the Global AIDS Pandemic
What are the Structural Drivers of Spread Across Eurasia? Driver # 1 Geographic proximity to overland drug trafficking routes Driver # 2 Limited use of HIV prevention measures with demonstrated efficacy for IDU transmission Driver # 3 Punitive and legalistic approaches to IDUs
Opiate seizures in Asia in 2004 Source : UNODC World Drug Report 2006
IDUs Reached by NSEP, Select FSU Countries, 2005 UNAIDS recommends 60% coverage for effective HIV prevention among IDUs Sources: IDU Estimates: UNODC HIV/AIDS unit, September 2005; WHO/UNAIDS October 2005. Published in Harm Reduction Developments 2005. International Harm Reduction Development Program (IHRD) of the Open Society Institute
Structural limits on prevention & care for IDU • US continues ban on federal funding for Needle Syringe Exchange Programs (NSEP) in US and globally • Methadone Maintenance Therapy (MMT) remains illegal in many countries Ex: Russian Federation • Across 50 developing countries, 34,000 IDU on ARV: 30,000 were in Brazil Source: Aceijas, et al, Addiction, 2006
% Δ / year 20000 2.7 MSM 15000 −3.9* HC HIV / AIDS 10000 IDU −9.1* 5000 −3.4* MSM/IDU 0 2001 2002 2003 2004 Year of Diagnosis Estimated Number of HIV/AIDS Diagnoses, by Transmission Category — 33 States, 2001–2004. * Statistically significant Source: Espinoza, CDC, 2005
Trends HIV among MSMmid ’90- now • HAART introduced, resulting in dramatic improvement of survival of AIDS patients, as well as reduction in AIDS cases • HIV/AIDS becomes a “chronic disease” and “less visible” • Rise in “unsafe sex” and STI , including outbreaks of Syphylis and LGV
Sexual orientation of male syphilis cases registered in the sentinel network of clinicians, Belgium, Oct 2000 - Jan 2003 From: IPH, Belgium
Possible explanations for increased risk behaviour • HAART changed the face of the epidemic: less AIDS and less deaths • Prevention fatigue: challenge of maintaining safe sex for an extended period • Changing environment : internet as new way of recruiting partners • Young MSM (<20y) sexually active earlier , and never exposed to AIDS as a killer disease
HIV prevalence among MSM in low prevalence settings Source: Wade et al. 2005; Girault et al. 2004; van Grievsven et al. 2005; Action for AIDS Singapore, 2006, Go et al. 2004; Pando et al. 2006; UNAIDS, 2006; Caceres et al, 2005, Strathdee, et al, 2006. CENSIDA, CA State Office of AIDS; Patterson et al, IAS, 2006; Strathdee et al, pers. comm; Viani et al, 2006
HIV prevalence among MSM, Bangkok, Thailand 2003 40 2005 35 30.5 29.7 28.3 30 25 22.3 HIV Prevalence (%) 20.8 20 17.5 17.3 15 12.9 10 5 0 Age (years) ≥29 ≤22 Overall 23-28 N = 194/1,121; 113/399 p-values all < 0.05 Source: Van Griensven, et al, MMWR. 2006
MSM structural risk contexts • Criminalization and stigma limit MSM access to HIV prevention, treatment and care • MSM understudied in emerging contexts: MSM not included in national HIV surveillance in Thailand, Vietnam, Senegal • Only one African study (Wade, et al) of MSM risk and HIV rates • Fewer than 1 in 10 MSM worldwide have access to necessary prevention services Sources: UNAIDS; USAID, 2004; Wade 2005; Go 2006 personal communication; HRW; UNAIDS 2006
HIV prevalence in adults in Africa Source : UNAIDS, 2006
Adult HIV prevalence in Sub-Saharan Africa, 2003 and 2005. Source: UNAIDS 2006 Report on the Global AIDS Epidemic
45 Males 40 33.3 35 Females 23.9 30 25 HIV Positive (%) 20 12.1 15 9.4 10 6.0 3.2 5 0 15 – 19 20 – 24 25 – 29 Age group (years) HIV prevalence by age and gender South Africa 2005 Source: South African National HIV Prevalence, Incidence, Behavior and Communication Survey, 2005
Ecological Model for HIV Risk in Southern Africa HIV Epidemic Stage Human Rights Contexts, The Condom Gap, Sexual Health Education Autonomy of Women and Girls, Stigma, Mobility, VCT Access, Sexual Norms and Beliefs, ARV Access Intimate Partner Violence, STI, Labor Migration Condom Usage, Concurrent Partnerships Condom Usage, Circumcision, HSV-2/GUD, Viral Load, Acute Infection, Age of Coital Debut, Marriage, ARV Status Individual Risks for HIV Infection Widening Risk Contexts for HIV Infection Beyrer & Baral, 2006