Download
1 / 45
450 likes | 607 Vues
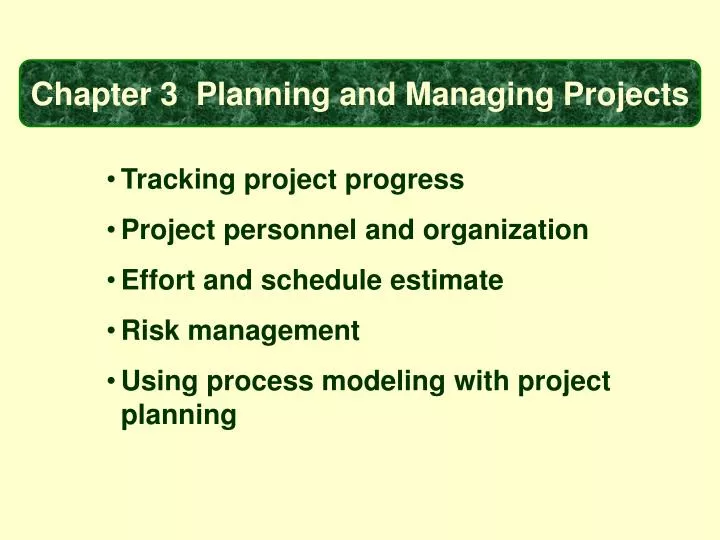
Chapter 3 Planning and Managing Projects. Tracking project progress Project personnel and organization Effort and schedule estimate Risk management Using process modeling with project planning.

E N D
Chapter 3 Planning and Managing Projects • Tracking project progress • Project personnel and organization • Effort and schedule estimate • Risk management • Using process modeling with project planning
1995年SEI统计,美国共取消了810亿美元的商业软件项目,其中31%的项目未做完就被取消,53%的软件项目进度通常要延长50%的时间,只有9%的软件项目能够及时交付并且费用也控制在预算之内。1995年SEI统计,美国共取消了810亿美元的商业软件项目,其中31%的项目未做完就被取消,53%的软件项目进度通常要延长50%的时间,只有9%的软件项目能够及时交付并且费用也控制在预算之内。 2000年TechRepublic公司发表了有关IT项目的调查结果。该调查是以北美的1375个IT专家为对象实施问卷调查进行的。根据此调查,IT项目中有40%失败,这些项目的平均成本每年花费100万美元。 ……,if a post mortem were to be conducted for every project,it is very likely that a consistent theme would be encountered:project management was weak 问题 1.什么是软件项目管理? 2.软件项目管理的内容是什么? 3.如果我是项目经理,我应该做什么 4.我可以胜任软件项目管理吗?
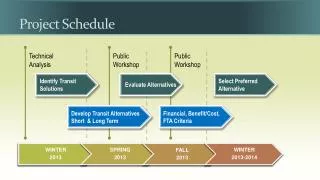
3.1 Tracking Progress • Usually, customers have several questions to be answered: • Do you understand my problems and my needs? • Can you design a system that will solve my problem or satisfy my needs? • How long will it take you to develop such a system? • How much will it cost to have you develop such a system? A Project Schedule describes the software development cycle for a particular project by enumerating the phases or stages of a project and breaking each into discrete tasks or activities to be done. The schedule also portrays the interactions among these activities and estimates the time that each task or activity will take.
Activity1.1 Step 1 Activity1.2 Phase 1 Step 2 Activity1.3 : : Activity1.1 Step 1 Activity1.2 Project Phase 2 Activity1.3 Step 2 : : : Step 1 Phase n Step 2 : Milestone: some events, and they indicate to us and our customers that a measurable level of progress has been made. The distinguishing between activities and milestones: A activity is a part of the project that takes place over a period of time; A milestone is the completion of an activity and occurs at a particular point in time. Work breakdown structure
Step 1.1: clearing and grubbing Activity1.1.1: Remove trees Activity1.1.2: Remove stumps Activity1.2.1: Aerate the soil Step 1.2: seeding the turf Phase 1: Landscaping the Lot Activity1.2.2: Disperse the seeds Activity1.2.3: Water and weed Activity1.3.1: Obtain shrubs and trees Step 1.3: planting shrubs and trees Activity1.3.2: Dig holes Activity1.3.3: Planting shrubs and trees Activity1.3.4: Anchor the trees and mulch around them
Step 2.1: prepare the site Activity2.1.1: Survey the land Activity2.1.2: Request permits Activity2.1.3: Excavate for the foundation Activity2.1.4: Buy materials Activity2.2.1: Lay the foundation Activity2.2.2: Build the outside walls Step 2.2: Building the exterior Phase 2: Building the House Activity2.2.3: Install exterior plumbing Activity2.2.4: Exterior electrical work Activity2.2.5: Exterior siding Activity2.2.6: Painting the exterior Activity2.2.7: Install doors and fixtures Activity2.2.8: Install roofs Activity2.3.1: Install interior plumbing Step 2.3: Finishing the interior Activity2.3.2: Install interior electrical work Activity2.3.3: Install wallboard Activity2.3.4: Painting the interior Activity2.3.5: Install floor covering Activity2.3.6: Install doors and fixtures
Milestones in building a house 1.1 Survey complete 1.2 Permits issued 1.3 Excavation complete 1.4 Materials an hand 2.1 Foundation laid 2.2 Outside walls complete 2.3 Exterior plumbing complete 2.4 Exterior electrical work complete 2.5 Exterior siding complete 2.6 Exterior painting complete 2.7 Doors and fixtures mounted 2.8 Roof complete 3.1 Interior plumbing complete 3.2 Interior r electrical work complete 3.3 Wallboard in place 3.4 Interior painting complete 3.5 Floor covering laid 3.6 Doors and fixtures mounted
Work Breakdown and Activity Graphs The four parameters to describe each activity: A precursor: is an event or set of events that must occur before the activity can begin, it describes the set of conditions that allows the activity to begin. The duration: is the length of time needed to complete the activity. The due time: is the date by which the activity must be completed. The endpoint: is usually a milestone or deliverable, and represents the end of the activity. An activity graph: the nodes of the graph are the project milestones, and the lines linking nodes represent the activities involved.
START Request permit surveying 1.2 1.1 excavation 1.3 Buy materials 1.4 Lay foundation 2.1 Install exterior plumbing Build outside wall 3.1 2.3 2.2 Install interior plumbing Install interior electrical Install exterior electrical 3.2 2.4 Install wallboard Install exterior siding Paint interior 3.3 2.5 3.5 Install flooring Paint exterior Install roofing 3.4 2.6 Install interior doors and fixtures Install exterior doors and fixtures 2.8 3.6 2.7 FINISH
START 15 3 1.2 1.1 10 1.3 10 1.4 15 2.1 20 10 3.1 2.3 2.2 12 15 10 3.2 2.4 9 8 11 3.3 2.5 3.5 5 18 9 3.4 2.6 7 2.8 0 6 3.6 0 2.7 0 0 FINISH Estimating Completion
Critical Path Method(CPM) The paths can show us the minimum amount of time it will take to complete the project, given our estimates of each activity’s duration. CPM reveals those activities that are most critical to completing the project on time. Slack time= available time – real time Slack time= latest start time – earliest start time The critical path is the one for which the slack time at every node is zero. And it determines whether or not the project is on schedule.
Activity Earliest Start time Latest Start Time Slack time 1.1 1 13 12 1.2 1 1 0 1.3 16 16 0 1.4 26 26 0 2.1 36 36 0 2.2 51 51 0 2.3 71 83 12 2.4 81 93 12 2.5 91 103 12 2.6 99 111 12 2.7 104 119 15 2.8 104 116 12 3.1 71 71 0 3.2 83 83 0 3.3 98 98 0 3.4 107 107 0 3.5 107 107 0 3.6 118 118 0 Finish 124 124 0
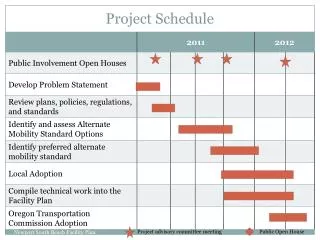
The bar chart Description Test of phase 1 Define test cases Write test plan Inspect test plan Integration testing Interface testing Document results System testing Performance tests Configuration tests Document results Early Date 1 Jan 98 1 Jan 98 9 Jan 98 9 Jan 98 23 Jan 98 23 Jan 98 23 Jan 98 2 Feb 98 2 Feb 98 2 Feb 98 17 Feb 98 Late Date 5 Feb 98 8 Jan 98 22 Jan 98 22 Jan 98 1 Feb 98 1 Feb 98 1 Feb 98 17 Feb 98 17 Feb 98 17 Feb 98 24 Feb 98 Jan 1 Jan 8 Jan 15 Jan 22 Jan 29 Feb 5 Feb 12 Feb 17 Feb 24 ****************** ***** ****** ****** ***** --FFFF -----FF ******* *** ----------FFFFFF --------FFFFFFF ***
Review specification (1.1) Review budget (1.2) Review schedule (1.3) Develop plan (1.4) System planning (1.0) Build communication software Top-level design (2.1) Prototyping (2.2) User interface (2.3) Detailed design (2.4) System design (2.0) Coding (3.0) Testing (4.0) Delivery (5.0) Tools to Track Progress
Gantt Chart: a depiction of the project where the activities are shown in parallel, with the degree of completion indicated by a color or icon, the chart helps to understand which activities can be performed concurrently, and also to see which items are on the critical path. Load Overload Projected Staff-Days Underload JAN FEB MARAPR MAY JUN JUL AUG SEP OCT NOV DEC
Specification approved budget approved schedule approved plan approved design approved design approved TODAY
Computer-Aided Software Engineering Tools 4x * Size(SLOC) + Cost($) 2x * + * 1.5x * + + * + 1.25x * + + * * x + * + + * + + * 0.5x * + Detailed design specs. Product design specs. * Accepted software Concept of operations Requirement specs. 0.25x Product design Detailed design Development& test feasibility Plans& requirement 3.3 Effort Estimation The project budget pays for several types of costs: facilities, staff, methods, and tools facilities staff methods tools Effort
Expert Judgment Method 1: calculate the average of estimates. Method 2: sit a meeting to make the experts agree on some estimate Method 3: Deiphi technology • Every expert estimates; • Estimate in meeting; • ai----the possibility of software minimal size • mi----the most possibility of software size • bi----the possibility of software maximal size • Ei =(ai +4mi +bi)/6 • Discuss and estimate again in meeting • Get an estimate with secrete ballot
Difficulty Type of software OE OM OH NE NM NH Control 21 27 30 33 40 49 Input/output 17 24 27 28 35 43 Pre/post procedure 16 23 26 28 34 42 Algorithm 15 20 22 25 30 35 Data management 24 31 35 37 46 57 Time-critical 75 75 75 75 75 75 Method 4: software cost matrix Old and Easy I/O module: 100 LOC New and Hard Algorithm module: 200 LOC Old and Medium Data management module: 100 LOC A system Cost=(100×17)+(200 ×35)+(100 ×31)=11800$
R – 1 if R>=1 1–1/R if R<1 (1+ERad) E if R>=1 E/(1+Erad) if R<1 Eadj= Algorithmic Methods • IBM model • E=5.25S0.91 • S is the estimated size of the system, E is the effort(PM). • meta-model • E=5.5+0.73S1.16 • if R=(actual effort)E/(predicted effort)E’ • then ERadj=
3. COCOMOⅡ (Constructive Cost Model) COCOMO Ⅱestimation process reflects three major stages of any development project: Stage 1: projects build prototypes to resolve high-risk issues involving user interfaces, software and interaction, performance, or technological maturity. COCOMOⅡ estimates size in application points. Stage 2: the early design stage, the designers must explore alternative architectures and concepts of operation. COCOMOⅡ estimates size in function points. Stage 3: the postarchitecture stage, sizing can be done in terms of function points or lines of code,.
The basic form of COCOMOⅡ: E=bScm(X) Wherethe initial size-based estimate bSc is adjusted by the vector of cost driver information m(X)
Planning Planning Coding Testing Coding other Brooks Yourdon Finding the Model for your Situation two statistics to help you in assessing the accuracy: PRED: PRED(x/100) is the percentage of projects for which the estimate is within x%100 of the actual value. MMRE: is the mean magnitude of relative error.
3.4 Risk Management • What is risk? • Risk pays more attention to the future events. • Risk relates to changing. • Risk relates to choice and the uncertainty involved in choice. The characteristics of risk: ① uncertainty —— The event that characterizes the risk may or may not happen; ② loss —— If the risk becomes a reality, unwanted losses will occur.
Distinguish risks from other project events by looking for three things: • A loss associated with the event. • The loss associated with a risk is called the risk impact. • The likelihood that the event will occur. • The likelihood of the risk, measured from 0 (impossible) to1 (certainty) id called the risk probability. • When the risk probability is 1, it is called a problem. • The degree to which we can change the outcome. • Risk control involves a set of actions taken to reduce or eliminate a risk.
Risk exposure = risk impact × risk probability • There are two major sources of risk: • Generic risks: those common to all software projects, such as misunderstanding the requirements, losing key personnel, or allowing insufficient time for testing. • Project-specific risks: threats that result from the particular vulnerabilities of the given project.
Checklist Decomposition Assumption analysis Decision driver analysis System dynamics Risk identification Risk analysis Risk prioritization Performance models Cost models Risk assessment Network analysis Decision analysis Quality risk factor analysis Risk management Risk exposure Compound risk reduction Buying information Risk avoidance Risk transfer Risk reduction Risk management planning Risk resolution Risk reduction leverage Risk control Development process Risk element planning Risk plan integration Risk mitigation Risk monitoring and reporting Risk reassessment Risk Management Activities
COMBINEDRISK EXPOSURE RISK EXPOSURE L(UO)=$.5M P(UO)=0.75 $.375M Find critical fault L(UO)=$30M P(UO)=0.05 $1.5M $1.95M Don’t find critical fault yes L(UO)=$.5M P(UO)=0.20 $.10M No critical fault Do regression testing? L(UO)=$.5M P(UO)=0.25 $.125M Find critical fault no L(UO)=$30M P(UO)=0.55 $16.725M $16.5M Don’t find critical fault L(UO)=$.5M P(UO)=0.20 $.10M No critical fault The probability of an unwanted outcome: P(UO) The loss associated with unwanted outcome:L(UO) risk impact × risk probability = Risk exposure
(risk exposure before reduction – risk exposure after reduction) (cost of risk reduction) • There are three strategies for risk reduction: • Avoiding the risk, by changing requirements for performance or functionality • Transferring the risk, by allocating risks to other systems or by buying insurance to cover any financial loss should the risk become a reality • Assuming the risk, by accepting it and controlling it with the project’s resources Risk leverage:
Project scope Project schedule Project team organization Technical description of the proposed system Project standards, procedures, and proposed techniques and tools Quality assurance plan Configuration management plan Documentation plan Resource management plan Test plan Training plan Security plan Data management plan Risk management plan Maintenance plan 3.5 Project Plan
Risk assessment Risk management Risk control Review The project schedule Work breakdown structure (phase-step-activity) An activity VS a milestone An activity graph The Critical Path Method Gantt chart Project personnel Effort estimation (Expert judgement and Algorithmic methods) Project plan
项 目 管 理 案 例 分 析 1.整体性案例 Government Business Process Automation 2 专项讨论案例 关于进度问题
Government Business Process Automation 某城市人民政府进行机构改革,新成立了一个部门——城市管理办公室,负责城市水电、交通、环保、绿地等基础设施以及城市应急处理工作。为了使得新成立部门高效率运转,政府决定利用信息系统辅助该部门的日常业务。经过商讨,最终决定投资2500万元建立三套信息系统,一套是办公自动化系统,一套是数据采集与交换系统,一套是城市应急指挥调度系统,三个系统作为一个项目进行招标,经过激烈的竞争,最终选取了在系统集成、MIS、GIS方面经验丰富的A公司,项目建设周期为1年。 A公司经讨论确定成立一个由26人组成的项目开发小组,并制订了大致的开发计划如下: 1. 前期准备工作 一周 2. 项目开发工作 9个月 3. 系统试运行 2个月 4. 系统验收 15天
请你试着回答以下一些问题: 1.你认为9个月完成项目开发有可能吗,依据是什么 2.根据你对城市管理的了解和猜测,试着评估一下这个项目拥 有的资源。 3.请为该项目建立一个风险表。 4.选择你熟悉的工具确定这个项目的生存周期和项目进度表以及 人员分工组织。 5.为了确保项目质量,请谈一谈如何进行复审以及复审的时间、 内容、方式。 6.请为该项目建一个配置管理库。 7.制订一份完整的软件开发计划书,格式自定。
1.你认为9个月完成项目开发有可能吗,依据是什么1.你认为9个月完成项目开发有可能吗,依据是什么 合计:99451 功能点计算:99451 * (0.65 + 0.01 * (5+5+0+5+0+2+0+2+1+3+3+3+0+5)) = 98456.49 按照以往项目开发经验,每个人每月能够完成的功能点数为450左右,则26个人9个月能够完成功能点105300。 结论:9个月能够完成项目,但是项目周期需要设计的比较紧凑(此外初期的功能点估算往往误差较大,需要在设计阶段修正)
2.根据你对城市管理的了解和猜测,试着评估一下这个项目拥 有的资源。 软硬件环境方面:本项目资金充裕,可以购置足够的硬件和软件工具,因此能够保证硬件和软件工具在项目开发任何阶段可用。 可复用组件方面:本项目无可以直接复用的软件组件,完全需要自行开发 人员方面:需要分解工作任务,建立工作任务之间的并行关系,并根据工作进度详细安排对人员组织进行计划
风险评估表 风险ID:SZ_1011 日期:2001/03/03 概率评估:50 % 影响级别:中 风险描述:三个系统之间的接口定义不明确可能导致三个系统内部返工,特别是办公自动化系统采用B/S结构还是C/S结构直接影响另外两个系统与它的集成方式 发生条件:当办公自动化系统提供接口不能满足另外两个系统的功能需求;当接口由三个独立小组分别定义;当有一个接口不能实现双向调用时 监控手段:在每次需求的评审后召开专门的非正式风险评估会议对该风险重新评估;在每次详细设计的正式评审会议召开后再召开专门的正式风险评估会议 管理计划:当确认该风险发生后应召开正式的风险管理会议,确定责任人、修订内容、修订跟踪和评审周期、修订评审形式和时间 当前状态:监控中; 编写人:xxx 责任人:xxx 版本状态 当前版本 1.00.0000 修订时间 修订人 审计人 xxx xxx 3.请为该项目建立一个风险表。 应建立类似下表的风险评估单,责任人应是明确的,并且不与其它资源发生冲突
4.选择你熟悉的工具确定这个项目的生存周期和项目进度表以及人员分工组织。4.选择你熟悉的工具确定这个项目的生存周期和项目进度表以及人员分工组织。 由于系统的复杂性和工作量,项目开发采用风险最小的原型法,大致分成4个阶段: 1.界面原型阶段 以用户界面为主设计原型,反复进行直到用户满意,同时完成需求分析 2.设计原型阶段 以系统结构、模块结构为主设计原型,与用户交流反映不同设计的比较,同时完成系统设计 3.功能原型阶段 在原型基础上实现系统功能,将原型变为产品 4.集成阶段 将三个系统集成起来 根据这样的进度安排,项目定义了三个里程碑:界面里程碑(需求里程碑);设计里程碑、集成里程碑(系统里程碑)。下表为项目进度甘特图
按照这样的进度计划,全体人员分成三个小组,即办公自动化小组、数据采集小组、应急指挥小组,每个小组又细分成数据设计人员、服务设计人员、代理设计人员、客户设计人员,每个小组设立两个小组长,一个负责技术协调,一个负责评审、质证、风险控制、绩效考核等管理工作按照这样的进度计划,全体人员分成三个小组,即办公自动化小组、数据采集小组、应急指挥小组,每个小组又细分成数据设计人员、服务设计人员、代理设计人员、客户设计人员,每个小组设立两个小组长,一个负责技术协调,一个负责评审、质证、风险控制、绩效考核等管理工作
5.为了确保项目质量,请谈一谈如何进行复审以及复审的时间、5.为了确保项目质量,请谈一谈如何进行复审以及复审的时间、 内容、方式。 提供三种复审方式 小组内部复审,在小组内部进行,需要提交《复审报告》,由小组长组织 项目组复审,在项目组内部进行,需要提交《复审报告》,由项目经理组织 外部复审,邀请客户代表、技术经理参加,需要提交正式的《复审计划书》、《复审会议纪要》、《复审意见表》、《复审报告》,只有里程碑和基线变更才需要进行外部复审,由项目经理组织
在项目进行的不同阶段,先后出现了一些异常情况,请根据情况回答问题在项目进行的不同阶段,先后出现了一些异常情况,请根据情况回答问题 . 在项目进行了1个月后,发现需求中要求实现与电力、交通、自来水等等十二个公司之间已经建成的监控系统之间进行数据交换,这些系统具有不同的物理数据库,不同的传输协议,不同的文件格式,在技术上存在很大的困难,这是原先没有预计到的。 在项目进行到4个月后,在质量审计活动中发现大部分项目都存在不同程度的质量问题,导致项目管理者处于矛盾之中:如果返工,则开发进度严重推延;但是如果继续下去,可能导致最终产品不合格,从而需要更多的试运行时间,最后进度还是拖延 在项目进行到6个月后,开始出现开发进度拖延问题,6月初几乎每一个计划中任务都拖延半天到一天,到6月下旬计划开始拖延三天甚至一周 请仔细分析这三种情况,并分别制订具体的行动计划
以上三种现象是软件项目常见的问题,即没有预料的技术障碍、质量问题和进度拖延。以上三种现象是软件项目常见的问题,即没有预料的技术障碍、质量问题和进度拖延。 对于第一个问题,客观原因是缺乏技术经验,主观原因是工作量度量和风险控制计划不当造成的,碰到这种情况,不仅需要进行技术攻关,而且需要对原有项目开发计划的所有内容重新进行评估,看来拖延是不可避免的,这也是项目组最艰难的时期。 对于第二个问题,导致的原因可能是多方面的(进度太紧、奖惩机制、管理者能力)。首先应对整个项目组的生产率进行评估,根据评估结论决定是否降低质量标准,如果项目组的生产率完全适应质量计划,则说明人为因素导致质量下降 对于第三个问题,明显是属于进度计划和工作任务分解不合理造成的,主要是指在制订计划时忽略了最早完成和最晚完成之间的差,从而失去了控制进度的余地,只有重新修正进度和分解任务,使得并行程度更高,才能赶回进度,否则拖延是不可避免的
进度拖延了 XX公司是一家专门从事系统集成和应用软件开发的公司,公司目前有员工50多人, 公司有销售部、软件开发部、系统网络部等业务部门,其中销售部主要负责进行公司服务和产品的销售工作,他们会将公司现有的产品推销给客户,同时也会根据客户的具体需要,承接应用软件的研发项目,然后将此项目移交给软件开发部,进行软件的研发工作。软件开发部共有开发人员有18人,主要是进行软件产品的研发,及客户应用软件的开发。 经过近半年的跟踪后,今年元旦,销售部门与某银行签订了一个银行前置机的软件系统的项目,合同规定,5月1日之前系统必需完成,并且进行试运行。在合同鉴定后,销售部门将此合同移交给了软件开发部,进行项目的实施。A被指定为这个项目的项目经理,A做过5年的金融系统的应用软件研发工作,有较丰富的经验,可以作系统分析员,系统设计,但作为项目经理还是第一次。另外项目组还有另外4名成员, 1个系统分析员,2个有1年工作经验的程序员,1个技术专家(不太熟悉业务)。项目组的成员均全程参加项目。 在被指定负责这个项目后,A制定了项目的进度计划,简单描述如下为:1) 1月10日~1月20日需求分析2) 1月21日~2月25日系统设计,包括概要设计和详细设计3) 2月26日~4月10日编码4) 4月11日~4月30日系统测试5) 5月1日试运行 但在2月17日A检查工作时发现详细设计刚刚开始,2月25日肯定完不成系统设计, 您建议A应该如何做?他在项目的管理中有问题吗?
应思考的问题: 1.拖延的原因是什么?责任人是谁? 2.有风险管理计划吗?风险计划中是否考虑了进度拖延问题? 3.如何更准确的估算和安排工作量和时间进度 问题的思考结果: 1.存在过度设计;项目估算偏差;过程模型选择错误;前期计划缺乏与用户非技术交流 2.没有,前期计划不完整 3.需要有专门人员重新进行工作量和时间进度估算,充分利用历史项目信息 解决方案: 1.改瀑布型过程模型为快速原型法;安排项目经理、系统分析员和专家加班重新计算工作量和进度;重新分解关键任务,增加并行度;确定增加人手能否改善目前状况 2.协调销售部门帮助联系用户,增强与用户方非技术方面的沟通 3.在2的前提下缩减设计复杂度 4.重要的是,对1、2、3的成果进行正式审计工作,并邀请用户加入评审组
请对以下问题展开讨论,并制订系统开发计划书请对以下问题展开讨论,并制订系统开发计划书 1.编写一个简要的系统描述,用简洁的语言说明这个项目要做什么(项目目标)以及项目最终的软件产品有什么 2.使用什么技术路线开发系统,开发系统需要多大的工作量(人月或者LOC) 3.你认为在项目开发过程中会产生哪些不利因素,怎样避免这些不利因素的产生 4.为你们小组的项目制订一个进度时间表 5.根据时间表确定项目里程碑,并说明在里程碑,并说明在里程碑点产生的软件 产品有哪些 6.你们计划做质量评审吗?如果需要做的话,请说明质量评审的办法和有关人员