Download
1 / 18
200 likes | 591 Vues
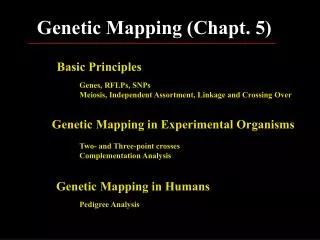
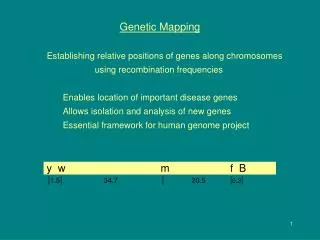
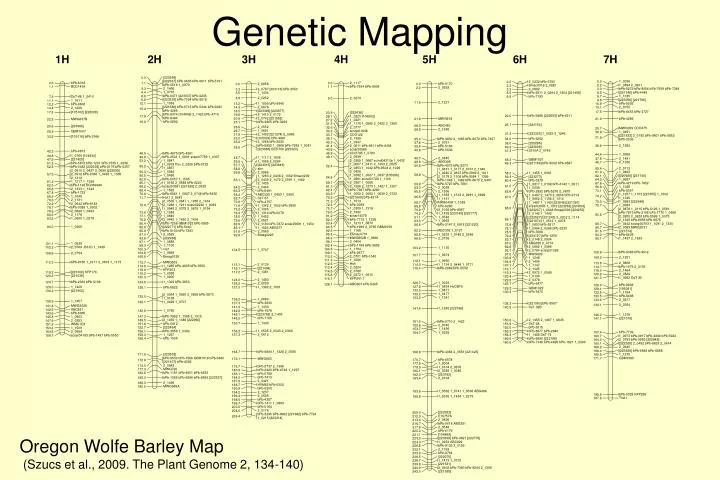
Genetic Mapping. Oregon Wolfe Barley Map (Szucs et al., 2009. The Plant Genome 2, 134-140). Genetic Maps. A genetic map or linkage map is a representation (table or figure) of the position of genes (or markers) within a linkage group.

E N D
Genetic Mapping Oregon Wolfe Barley Map (Szucs et al., 2009. The Plant Genome 2, 134-140)
Genetic Maps • A genetic map or linkage map is a representation (table or figure) of the position of genes (or markers) within a linkage group. • The map positions are inferred from recombination frequencies between genes (or markers).
Genetic Maps • Crossovers tend to be randomly but not uniformly distributed along a chromosome. Crossovers are suppressed in some chromosomal regions. - map distance ≠ physical distance • Recombination frequency increases monotonically with a maximum of 50%. - genetic mapping based on recombination frequencies should indicate the correct order of genes or markers on the chromosome
Uses of Genetic Maps • Genomic architecture • Gene localization • Genetic dissection of complex traits • Marker assisted selection • Starting point for map-based cloning • Starting point for genome sequencing
1 2 1 2 3 4 1 2 3 4 A A a A a a A A a a B b b B b B B B b b Gametes Anaphase II NR 4 a b 4 NR 2 1 b a b A A B R 3 3 a B 1 a B A B R 2 b A Mendelian Inheritance and Crossing Over After DNA replication Pairing and crossing over Pre-meiotic Heterozygous parent Anaphase I 1 2 3 4 A A a a B B b b
1 2 3 4 A A a a B B b b Gametes Non Recombinant n1 4 b a Non Recombinant n2 1 A B Recombinant n3 3 a B Recombinant n4 2 b A Parent Total N Recombination frequency
Linkage and recombination • Two genes are said to be linked when they are located on the same chromosome. • Linked genes tend to be passed together from parent to offspring. • As a result of recombination during meiosis the alleles of a linked pair of genes may become ‘separated’, and non-parental combinations of alleles may be transmitted to the gametes (and to the offspring). • The probability of a recombination event (crossing over) during meiosis depends on the distance between two gene loci. Therefore, the observed recombination frequency between loci is a measure for their ‘chromosomal distance’, or genetic map distance.
Linkage and recombination • The map distance between two loci of the same chromosome may be so large that these loci behave as if they were unlinked: they segregate independently, as if they were on different chromosomes. • The unit of genetic map distance is the centimorgan. One centimorgan (cM) corresponds to 1% recombination frequency.
Detection of Linkage • The most direct way to detect linkage would be to observe the genotypes, and their frequencies, of gametes produced by a parent that is heterozygous at two linked loci. • This is not possible in most plant species (an exception are doubled haploids (DH).) • Therefore, we need to apply indirect ways of observation, which means not observing individual gametes but the result of fused gametes, i.e. the diploid offspring of a diheterozygous parent, or two diheterozygous parents. In practice, linkage of gene loci is inferred from the observation that among the offspring traits are associated (‘go together’) rather than segregating independently.
Detection of Linkage • The most classical and easiest way to indirectly observe gamete genotypes and their frequencies is the testcross or backcross. (there is a one-to-one relation between genotype of gametes produced by the double heterozygous parent and the phenotype of the offspring).
Parent 1 AB/AB Parent 2 ab/ab BACKCROSS (test cross) A A a a coupling linkage phase X B B b b Locus A: Seed Color (A>a) Allele A: Green Allele a: Yellow Locus B: Seed Shape (B>b) Allele B: Spheric Allele b: Dented F1 AB/ab Parent 2 ab/ab (tester) A a X a a B b b b R: Ab/ab NR: ab/ab NR: AB/ab R: aB/ab Test Cross Offspring A a A a a a a a B b b b b b B b
R: Ab/ab NR: ab/ab NR: AB/ab R: aB/ab Test Cross Offspring expected frequency AB/ab Non Recombinant Ab/ab Recombinant Recombinant aB/ab A a A a a a a a Non Recombinant ab/ab B b b b b b B b
Estimation of recombination frequency • In the testcross the frequencies of recombinant and non-recombinant gametes can be obtained by simply counting the two classes of phenotypes. • In many other cases, there is no such a one-to-one relation between phenotype of offspring and the gamete genotype that gave rise to this phenotype. • There is a universally applicable method to obtain an estimate of recombination frequency from observed phenotype frequencies among the offspring. This method is known as the maximum likelihood method.
Estimation of recombination frequency • Let a sample of N gametes contain k recombinant and N-k non-recombinant gametes. • For any value of r this sample composition has a probability or likelihood, the binomial probability. For any value of r (0 ≤ r ≤ 1) this probability can be calculated. There is one, unique, value of r for which L is largest. This value of r maximizes the likelihood of the sample composition (hence ‘maximum likelihood estimation’, ML). This value of r can be obtained by taking the derivative of L with respect to r and equating this to zero:
Easier to take the derivative of Ln(L) Since ln(L) is monotonic, the value of r that maximizes ln(L) also maximizes L. Application of the above yields Solving for r yields or
Linkage Phase Coupling - cis Parent 2 (ab/ab) F1 (AB/ab) Parent 1 (AB/AB) A B a b A B X a b A B a b Repulsion - trans Parent 2 (aB/aB) F1 (Ab/aB) Parent 1 (Ab/Ab) A b a B A b X a B A b a B
Parent 1 Ab/Ab Parent 2 aB/aB A A a a BACKCROSS Repulsion linkage phase X b b B B Locus A: Seed Color (A>a) Allele A: Green Allele a: Yellow Locus B: Seed Shape (B>b) Allele B: Spheric Allele b: Dented F1 Ab/aB Parent 2 aB/aB A a X a a b B B B R: AB/aB NR: aB/aB NR: Ab/aB R: ab/aB BackCross Offspring A a A a a a a a b B B B B B b B
R: AB/aB NR: aB/aB NR: Ab/aB R: ab/aB BackCross Offspring expected frequency Ab/aB Non Recombinant AB/aB Recombinant Recombinant ab/aB A a A a a a a a Non Recombinant aB/aB b B B B B B b B