Download
1 / 16
160 likes | 288 Vues
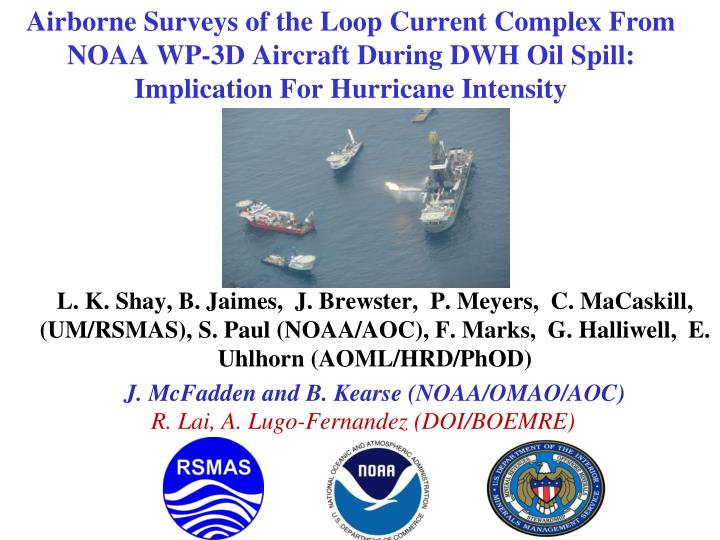
Airborne Surveys of the Loop Current Complex From NOAA WP-3D Aircraft During DWH Oil Spill: Implication For Hurricane Intensity. L. K. Shay, B. Jaimes , J. Brewster, P. Meyers, C. MaCaskill , (UM/RSMAS), S. Paul (NOAA/AOC), F. Marks, G. Halliwell , E. Uhlhorn (AOML/HRD/ PhOD )

E N D
Airborne Surveys of the Loop Current Complex From NOAA WP-3D Aircraft During DWH Oil Spill: Implication For Hurricane Intensity L. K. Shay, B. Jaimes, J. Brewster,P. Meyers, C. MaCaskill, (UM/RSMAS), S. Paul (NOAA/AOC), F. Marks, G. Halliwell, E. Uhlhorn (AOML/HRD/PhOD) J. McFadden and B. Kearse (NOAA/OMAO/AOC) R. Lai, A. Lugo-Fernandez (DOI/BOEMRE)
Tracks of Katrina and Rita (2005) in Northern Gulf of Mexico Relative to Oil Rigs. Over 35% of the Rigs were damaged or destroyed in the Gulf. Pain at the pump!
MOTIVATION: Katrina wind field with HRD wind fields (Powell et al). relative to the the LC and WCR based on satellite data in Aug 05. SST Image from TMI (lower panel). Is SST Enough? WCR LC FC In 2005: Katrina (896 mb), Rita (892 mb), Wilma (882 mb) Trifecta
Plan for NOAA WP-3D profiling over MMS Moorings (In collaboration with AOML HRD, AOC, TPC, NCEP) Deliverables include: V, T, S profiles to 1000 m @ 2-m resolution. Surface winds (SFMR, GPS) provided by HRD. Atmospheric profiles of V, T and RH @ 5-m resolution. Expendables deployed from P-3 and proposed moorings relative to the LC, WCE and CCE superposed on late Sept 05 altimetry derived 26oC isotherm Depth (After Rita).
Approach: • Airborne Expendables (AXCP :1500 m; AXBT: 350 m; AXCTD:1000 m; GPS) deployed in lawnmower pattern across the LC/Warm and Cold eddy features. • Flight level winds, temperatures, etc • Brightness temperatures from the Stepped Frequency Microwave Radiometer (SFMR) • Downward Looking IR • Downward Looking Camera • Nine Flights plus Bonnie Wake • Two Ocean Heat Content Mapping Flights for Hurricane Intensity Forecasting (satellite calibration) • Recurrent Theme: Ocean observations critical in improving oceanic and coupled modeling under weak and strong winds.
Subsurface thermostad (WP-3D data) • Remnant of a deep mixed layer caused by strong cold fronts? • Strong stratification over the upper 50 m. • Waters below the 100 m depth level get colder over time by effect of a developing cold core eddy. dh: layer thickness between the 19 and 20oC isotherms. Contours are the depth of the 20oC isotherms.
Anomalous low salinity in waters warmer than 19oC, including the thermostad. WP-3D data Anomalous buoyancy frequency (very strong stratification) Horizontal currents over the upper 200 m are predominantly SW (from the DWH rig). DWH rig AXCP AXCTD
Wind Rows Aligned with Winds-Langmuir Cells? Winds were about 3 to 5 m/s. Alternating convergence and divergence cells Implications redistribution of oil in surface layer and near-surface mixing.
T (°C), GoM HYCOM W P-3 Assimilation T (°C), GoM HYCOM W/O P-3 Assimilation ΔT, Impact of P-3 Assimilation (0.5°C contour interval)
Summary DWH Flights provided unprecedented coverage of an evolving Loop Current and eddy shedding. Need a coherent blueprint for the future when there is another oil spill. The GOM is an important contributor to ocean circulation that affects the eastern seaboard and impacts hurricane intensity . Targeted obs (LC or storm-coordinate system) of temperatures, currents and salinities needed to improve the models. We cannot solely rely on satellite data sets and synthetic T(z). Synthesizing differing data sets (expendables, floats, gliders, etc) into a coherent mosaic of complex processes that impact fragile ecosystems. Effectively assimilate data (update cycles?) into the oceanic models to better understand potential pathways of oil in real time-relevant to coupled models.