Download
1 / 56
560 likes | 659 Vues
Ch 2 Velocity. ~Motion in One Dimension~. Scalar versus Vector. Scalar – quantity that only has magnitude In the previous slide, which is the scalar? Vector – quantity that has magnitude and direction. In the previous slide, which is the vector?

E N D
Ch 2 Velocity ~Motion in One Dimension~
Scalar versus Vector • Scalar – quantity that only has magnitude • In the previous slide, which is the scalar? • Vector – quantity that has magnitude and direction. • In the previous slide, which is the vector? • What other examples of scalars can you think of? Vectors?
Scalar versus Vector 88 9 72 • Three friends drive their four wheelers a distance of 100.0 m. • Will they end up in the same place? Why or why not. • No, 100.0 m is a scalar and does not specify a specific direction. • Now suppose they drive 175.0 m due East. • Will they end up in the same place? Why or why not. • Yes, 100.0 m East is a vector. It has direction
0 -3 -4 -5 -6 -7 7 -2 5 4 3 2 1 -1 6 Reference Point Reference Point Reference Frame Reference Frames • A reference frame is an established coordinate system used to define motion. • The “zero” mark in a reference frame is called the reference point.
STOP 4 x 4 7 1 2 3 5 6 -7 4 -6 -4 -3 -2 -1 -5 0 X 35 X Reference Frame Position • An object’s position pertains to its location in the reference frame (on the number line). • For example the position of the truck. • The position of the bus. • Position values can be positive, negative, or zero. • The variables used for position are “x1” and “x2”. • Common units for position are meters (m). -5m 3m
0 1 2 3 4 5 6 7 8 9 10 11 12 13 14 15 16 3m 13m 16m Distance • Distance is the measure of separation between two objects. • It is given the variable “d” and is measured in meters (m). • If the positions are known, distance is calculated as follows. • The distance between the buoys be? • The distance from the shore to each buoy is. • Distance is a scalar quantity. 3m and 16m
Displacement • When an object is displaced, it is moved from an initial position (d1) to a final position (x2). • Displacement (variable Dx) is a measure of the change in position of an object after it has moved.
Example Displacement - Distance • John travels east along a straight highway and passes mile marker 260. John continues until mile marker 150 and then doubles back to mile marker 175. • What is Johns displacement from marker 260? • +85 miles • What is John’s distance from marker 260? • 85 miles • What is the total distance John traveled? • 135 miles
Example Displacement - Distance • John travels west along a straight highway and passes mile marker 260. John continues until mile marker 150 and then doubles back to mile marker 175. • What is Johns displacement from marker 260? • -85 miles • What is John’s distance from marker 260? • 85 miles • What is the total distance John traveled? • 135 miles
Distance Displacement
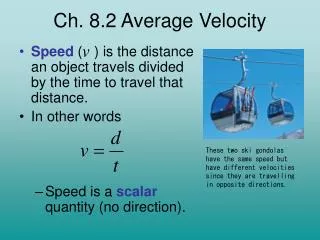
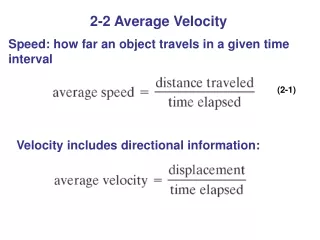
STOP 235 Speed • Speed: The measure of how fast something is moving. • It is the Rate at which distance is covered • Speed = distance / time
Finial position Initialposition Final time Initial time Average Velocity • Average Velocity – the change in position of an object over a given time interval. Vector or Scalar??
88 30 20 40 10 50 O 60 Instantaneous Speed • You raced your 4-wheeler over a 30 mile long track in 1.5 hours. • What is your average speed? • 20mph • Watch the animation. Is the speed always 20mph?
Instantaneous Speed • The actual speed at any “instant” in time. • e.g. The speedometer of a car is the instantaneous speed. • Average speed is total distance / total time.
Speed versus Velocity • Speed has no direction! • e.g. 25 miles per hour (mph) • Velocity has magnitude and direction! • e.g. 25 mph west. • Which is the vector and which is the scalar?
30 20 40 10 50 O 60 12 1 11 Position vs. Time Graph 2 10 250 3 200 9 150 100 4 8 50 Position (m) 5 7 0 6 -50 -100 -150 -200 -250 0 10 20 30 40 50 60 70 80 90 Time (s)
Position vs. Time Graph 25 20 15 10 5 Position (m) 0 -5 -10 -15 -20 -25 0 10 20 30 40 50 60 70 80 90 Time (s) What is the position of the object at t = 10s? What is the position of the object at t = 40s? What is the position of the object at t = 60s?
Position vs. Time Graph 25 20 15 10 5 Position (m) 0 -5 -10 -15 -20 -25 0 10 20 30 40 50 60 70 80 90 Time (s) Rise Run
Position vs. Time Graph 25 20 15 10 5 Position (m) 0 -5 -10 -15 -20 -25 0 10 20 30 40 50 60 70 80 90 Time (s) + Slope + Velocity Moving forwards - Slope - Velocity Moving backwards 0 Slope 0 Velocity Not moving
Position vs. Time Graph 25 20 15 10 5 Position (m) 0 -5 -10 -15 -20 -25 0 10 20 30 40 50 60 70 80 90 Time (s) During what time period(s) is the object moving forward? During what time period(s) is the object moving backwards? During what time period(s) is the object not moving?
Position vs. Time Graph 25 20 15 10 5 Position (m) 0 -5 -10 -15 -20 -25 0 10 20 30 40 50 60 70 80 90 Time (s) Find the velocity between 0s-15s 1m/s Find the velocity between 15s-30s 0m/s Find the velocity between 30s-50s -1.5m/s
Change in velocity Change in time Average acceleration Average Acceleration • The rate at which the Velocity changes. • Scalar or vector? What are the units of acceleration?
Practice Problem – Avg Acceleration • The velocity of a car increases from 2.0 m/s at 1.0 s to 16 m/s at 4.5 s. What is the car’s average acceleration? We know: We want:
Average Acceleration • Can an object speed up and have a negative average acceleration? • YES! • Let’s see an example how!
AHHH!!!! Negative a! Practice Problem – Avg Acceleration • Simon rolls backwards faster and faster down his driveway. He starts at -2.0 m/s and is moving at -9.0 m/s 2.0 s later. What is his average acceleration?
Average Acceleration • Can an object slow down and have a positive average acceleration? • YES! • Let’s see an example how!
AHHH!!!! Practice Problem – Avg Acceleration • Simon rolls up the other side of the ramp and slows down from-9.0m/s to -2m/s in 2s. What is his average acceleration?
Rise - Δd Run - Δt Instantaneous Velocity Draw a tangent line at the point that corresponds to that instant in time Find the slope of that tangent line at 5.0s, 2.0s, and 9.0s.
Position vs. Time Graph 25 20 Velocity vs. Time Graph 15 10 25 Position (m) 5 20 0 15 -5 10 Velocity (m/s) 5 -10 0 -15 -5 -20 -10 -25 -15 -20 0 10 20 30 40 50 60 70 80 90 -25 0 10 20 30 40 50 60 70 80 90 Time (s) Time (s) Position Time Graphs Velocity Time Graphs Position–Timegraphs lets us calculate velocity. Velocity–Timegraphs lets us calculate displacement (Dx).
Rectangle/Square Triangle Trapezoid Area Calculations • In order to calculate area, you will need to know how to find the area of different shapes.
Velocity vs. Time Graph 25 20 15 10 5 Velocity (m/s) 0 -5 -10 -15 -20 -25 0 10 20 30 40 50 60 70 80 90 Time (s) Find the displacement between 10s-25s. Displacement equals the area between the curve and the x-axis. (Dd = Area)
Velocity vs. Time Graph 25 20 15 Pos 10 5 Velocity (m/s) 0 Neg -5 -10 -15 -20 -25 0 10 20 30 40 50 60 70 80 90 Time (s) “Negative” Area • Area above the x-axis indicates positive displacement. • Area below the x-axis indicates negative displacement. • Negative velocity means negative displacement
Velocity vs. Time Graph 25 20 15 10 5 Velocity (m/s) 0 -5 -10 -15 -20 -25 0 10 20 30 40 50 60 70 80 90 Time (s) Find the distance traveled between 40-55s Displacement equals the area under the curve (Dd = Area)
Velocity vs. Time Graph 25 20 15 10 5 Velocity (m/s) 0 -5 -10 -15 -20 -25 0 10 20 30 40 50 60 70 80 90 Time (s) Find the distance traveled between 25-65s Displacement equals the area under the curve (Dd = Area)
Velocity vs. Time Graph 25 20 15 10 5 Velocity (m/s) 0 -5 -10 -15 -20 -25 0 10 20 30 40 50 60 70 80 90 Time (s) Find the displacement traveled between 10-55s Displacement equals the area under the curve (Dd = Area)
Velocity vs. Time Graph 25 20 15 10 5 Velocity (m/s) 0 -5 -10 -15 -20 -25 0 10 20 30 40 50 60 70 80 90 Time (s) Find the displacement between 40-75s 337.5m left
Δv Δt Velocity-Time What is the average acceleration of the object over the first 2 s? Slope of velocity-time graph is the average acceleration!!
Velocity-Time Graphs During what time period(s) does the object have a positive acceleration? During what time period(s) does the object have a negative acceleration? During what time period(s) is the object not accelerating?
Velocity-Time Graphs During what time period(s) is the sign of the velocity and acceleration opposite?
Δv Δt Instantaneous Acceleration – acceleration at one instant in time What is the instantaneous acceleration at 4 s? Draw the tangent line to that point. Find the slope of that line.
Constant Acceleration • Acceleration that does not change in time is uniform or constant acceleration. • On a Velocity-Time Graph, constant acceleration is a straight line
Velocity – Time Graph The slope is the Acceleration Acceleration
Velocity of an Object with Constant Acceleration • Constant Acceleration = Uniform Acceleration What would the graph of a versus t look like?
Velocity of an Object with Constant Acceleration Area under the curve Area under the curve D vs t a vs t v vs t slope slope
Zero Acceleration, Constant Speed We can use small triangles to visualize the distance traveled per increment of time. The same amount of distance is covered in the same amount of time. The speed of the object remained constant.
Negative Acceleration We can use small triangles to visualize the distance traveled per increment of time. The second triangle is much smaller that the first triangle. The larger size means that the body traveled more distance in the same increment of time The object was moving slower during the second increment. The object experienced a negative acceleration.
Positive Acceleration We can use small triangles to visualize the distance traveled per increment of time. The second triangle is much larger that the first triangle. The larger size means that the body traveled more distance in the same increment of time The object was moving faster during the second increment. The object experienced a positive acceleration.
Graphs of Motion • Label the three distance v. time graphs below as either accelerating positive, accelerating negative, or zero acceleration.
Velocity versus Time • Label the three velocity versus time graphs below as either • accelerating positive • accelerating negative • zero acceleration. • Simply read the values directly from the graph.
Displacement when Acceleration and Time are Known We will combine 2 equations we know to get another equation. Substitute v2 into first equation