Download
1 / 24
240 likes | 399 Vues
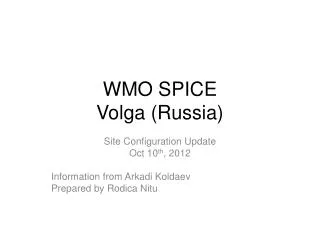
Volga and Kura Rivers. Mark Hannon, Albert Kettner, Irina Overeem, James Syvitski. Research Objective. Mapping of modern architecture of river systems draining to the Caspian Sea with remotely sensed topographic data

E N D
Volga and Kura Rivers Mark Hannon, Albert Kettner, Irina Overeem, James Syvitski
Research Objective • Mapping of modern architecture of river systems draining to the Caspian Sea with remotely sensed topographic data • Focus on Kura River and Volga River in both the lowermost floodplain and the delta plain. • Assess controlling factors for CP database: drainage area, river length, climate and basin characteristics, river mouth location, discharge and sediment load.
Datasets • We used Shuttle Radar Topography Mission (SRTM) data. NASA ran the Shuttle Radar Topography Mission and obtained interferometric synthetic aperture radar (InSAR) data during an 11-day mission to generate high-resolution digital elevation data for 80% of the Earth landmass, located between 60N and 59S. • The radar wavelengths in the cm to m range have a good signal return from rough surfaces (bare ground, rough water, vegetation), but may have less signal returns from smooth surfaces (sand sheets, calm water). Although heavy vegetated canopies have a good signal return, they might be biased in the vertical resolution, as the signal might not penetrate down to the land surface (Farr et al., 2007). • We employ the SRTM C-band data with a 5.6 cm wavelength. Many of the world’s flat-lying (deltaic) areas have a vertical RMSE (root mean square error) between 1.1 to 1.6 m (Schumann et al. 2008). • We used a by-product of the SRTM mission. The SWBD (Surface Water Body Data), created from Landsat classification of water and land, was used for calculation of river center lines and oxbow lake presence. • All data can be found at this url: http://dds.cr.usgs.gov/srtm/version2_1/
Methodology • We examined floodplain morphology at a 1m vertical binning, wherein we defined ‘floodplains’ as the area located between sea level and water surface elevation 100 m asl. • We measured sinuosity and slope over 5 meander wavelengths to obtain representative stretches of the selected rivers. • The Caspian Sea level was 29 meters below the WGS84 datum for global sea level in 2000, so 29 meters was added to the DEM for analysis. 5 meander stretch
Volgograd Dam River Characteristics Length (km): 3,660Drainage Area (km2): 1.4x10⁶Average discharge (m3/s): 7,600 Peak discharge (m3/s): 52,000 (1926) Suspended Sediment Load: 13.3-6.0 Mt/yr Sediment Size: 100-150 μm Bed-load: 23% of the Sediment Load Temperature: 10.8 (delta) Volga River mouth Location N 46 ۫ 11’ 48” E 48 ۫ 40’ 22”
Sinuosity of the three stretches downstream of the dam. The last meter of water elevation was not included as it is straightened to dredging for navigation.
Different segments in the river have a different ‘container valley’ width. The upper container valley is wider (27km), with a higher sinuosity for the river stretch (1.335). The middle section is narrower (19km) with a lower sinuosity (1.142). The lower section has a wide and less well distinguishable ‘container valley’.
The Volga delta fans out over 250km wide shoreline, with numerous distributary channels (100+ river mouths form a feathered pattern) (Kroonenberg et al., 1997))
Mid-channel bars and islands in the lowermost Volga River using the SWBD The mid-channel bars and islands (in red) in the last 637 km make up a total area of ~590 km2. An average of ~4 km2 with a st. dev of 10.7 km2. The largest being over 100 km2.
SRTM channel bars seen with a comparison of a 2010 Digital Globe Image. It can be clearly seen that large parts of the bars are vegetated and are now likely trapping fine sediments at flood stage, and only part of them are sandy and active depositional areas.
sandy, active deposition vegetated, present-day deposition likely dominated by fine sediment Mid-channel bars using Landsat Classification on a ~ 174 kmstretch of the Volga (Sinuosity of 1.142 Slope of ~2.3 cm/km).
1 2 a b Seen by red polygon are mid-channel bars delineated from Landsat. The point data (black spots fig. 2) represents pixels with the greatest irradiance and therefore are presumed sand. The bars appear to have grown, since the SRTM mission (grey areas fig. 1). Two bars (fig 2. a,b) showing great expansion, most likely as sand deposition.
The profiles appear to indicate that the scroll bars, from migrating channels, can be seen. Most likely amplified by vegetation the elevations vary dramatically.
Volga compared to previously analyzed river systems. The Volga river and delta system has a very low longitudinal slope, but the sinuosity appears anomaliously low for those particular slopes.
Kura River mouth location N 39۫ 19’ 40” E 49 ۫ 21’ 28” Length (km): 1,515Drainage Area (km2): 188,000 Average discharge (m3/s): 550 Monthly peak discharge (m3/s): 2,250 Average Sediment Volume: 8.8-11.3 x 10⁶ m3/yr Sediment Size: <200 μm Temperature: 14.1 C (basin)
Sinuosity 10 meander stretches 10 meander
Kura Oxbow lakes. 12 (8 are shown in red circles) lakes in the stretch examined, with a total surface area of 3.55 km2.
10 meander 10 meander
Results • The Volga river has a varying ‘container valley’ width along the channel, due to oscillating Caspian Sea Level stands. This appears to play effect the sinuosity. The upper container valley is wider (27km), with a higher sinuosity for the river stretch (1.335). The middle section is narrower (19km) with a lower sinuosity (1.142). The lower section has a wide and less well distinguishable ‘container valley’. • Although the data coverage is sparse for large bar areas, there seems to be a trend in percentage sand surface area versus total bar area. As the mid-channel bar area increases there is a decrease in percentage sand surface area. • Using the SWBD for the total 637 km stretch to the dam, the mid-channel bars make up a total area of 590 km2. • The Volga and Kura both have relatively low slopes (~1-7cm/km), but different sinuosity. The Volga is a multiple-threaded system, which results in it’s low sinuosity; whereas the Kura is a single threaded meandering system with higher values of sinuosity.
References S.B. Kroonenberg, Rusakov, G.V., and Isvitoch A.A. 1997. The wandering of the Volga delta: A response to rapid Caspian sea level change. Sedimentary Geology, 107: 189-209 Overeem, I.,Kroonenberg, S.B., Veldkamp, A., Groenesteijn, K., Rusakov, G. V.†, Svitoch, A.A., 2003. Small-scale stratigraphy in a large ramp delta: recent and Holocene sedimentation in the Volga delta, Caspian Sea. Sedimentary Geology 159, 133-157. Overeem, I., Veldkamp, A., Tebbens, L., Kroonenberg, S.B., 2003. Modelling Holocene stratigraphy and depocentre migration of the Volga delta due to Caspian Sea-level change. Sedimentary Geology 159, 159-175. R.M. Hoogendoorn Boels, J.F., Kroonenberga, S.B., Simmonsb, M.D., Aliveva, E., Babazadeh, A.D., and Huseynov, D. 2005. Development of the Kura delta, Azerbaijan; a record of Holocene Caspian sea-level changes. Marine Geology, 222–223: 359–380 Farr, T. G., et al. 2007. The Shuttle Radar Topography Mission, Rev. Geophys., 45, RG2004, doi:10.1029/2005RG000183. Schumann, G., Matgen, P., Cutler, M.E.J., Black, A., Hoffmann, L., and Pfister, L., 2008, Comparison of remotely sensed water stages from LiDAR, topographic contours and SRTM. ISPRS Journal of Photogrammetry & Remote Sensing, 63: 283-296. 10 meander