Download
1 / 21
210 likes | 317 Vues
STARS Cube Demonstration PED Data Conference Spring 2008. Session Objectives. Understand what cubes are and how they are different than traditional reports Understand basic cube functionality Understand the data in the student-related cubes

E N D
Session Objectives • Understand what cubes are and how they are different than traditional reports • Understand basic cube functionality • Understand the data in the student-related cubes • Be able to use the student-related cubes to generate own queries and analyses
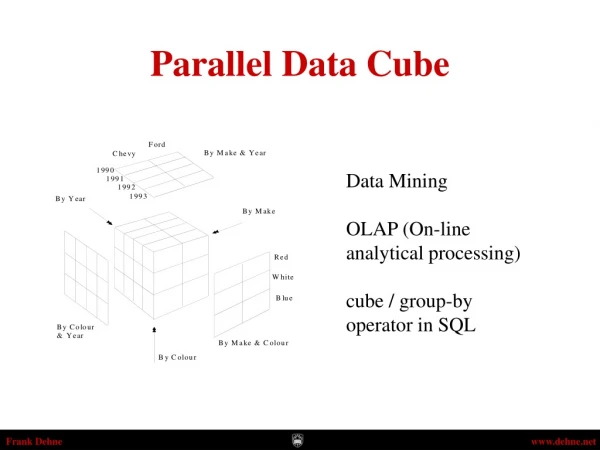
What are Cubes? • Cubes contain pre-summarized subject-oriented data • Dimensions • Measures • Cubes are dynamic and powerful • “Drill down” • “Slice and dice” • Filter data • Export data • Create charts • Similar to Microsoft Excel pivot tables • Accessed through Cognos • Cubes are accessible to both state and district level users • PED cubes only contain aggregated data; individual staff or student data is available in “Drill Through” reports
STARS Technical Overview District PED Student Snapshot Cube STARS Data Warehouse Staff Snapshot Cube District Student Information System Data Extracts Assessment Cube
Terms • MEASURE - a discrete, quantifiable data element, often preceded by “count” or “number of” • Number of Students • Number of Classes • DIMENSION - a qualitative column or row header that describes a measure, answers “when, where, why, and who” and is often preceded by the word “by” • By District • By Staff Gender • HIERARCHY - represent increasing level of detail available within each dimension District Location Age Range Age
Terms (cont’d) • OLAP – On-Line Analytical Processing – a method of analyzing data by applying and removing dimension hierarchies • “CUBE VIEWS” or REPORTS - have combinations of measures and dimensions that answer business questions
A Question... What was the total number of students by district by special education status for 40th day of school year 2008? • Measure: • # of Students • Dimensions: • District • School Year/Period • Special Education Status
What Cubes are Available? • Assessment • NMSBA results at the subtest, cluster and skill levels • Assessment Summary • NMSBA results at the subtest level • District/Location • Financial • Budget and actuals data submitted to OBMS • Programs Fact • Students programs such as BEP, T1A, T1C, 3Y, 4Y, etc. • School Enrollment • Special Education Snapshot • Staff Assignment • Staff Licenses • Based on AS/400 licensure system; contains current licenses for staff members whether or not they’ve been reported to STARS • Staff Snapshot • Student Course Enrollment • Classes, the students enrolled in classes and staff teaching them • Student Snapshot
Student Snapshot Cube • Based on the Student Snapshot fact table • Provides duplicated and unduplicated counts of students by various dimensions • Notes: • Includes BEP, BUS and BSCE Program dimensions sourced from the Programs Fact table • Grain: One record per district/school year/report period/student
Special Education Snapshot Cube • Based on the Special Education Snapshot fact table • Provides duplicated and unduplicated counts of special education students by various dimensions • Notes: • A Special Education Snapshot record will not appear in this cube if there is no corresponding Student Snapshot record for the individual and report period in question • Grain: One record per district/school year/report period/special education student
Programs Fact Cube • Based on the Programs Fact table • Provides unduplicated counts of students enrolled in programs such as 3Y, 4Y, 5Y, BEP, ELL, T1A, T1C, T3, T7, etc. • Notes: • A Programs Fact record will not appear in this cube if there is no corresponding Student Snapshot record for the individual and report period in question • Grain: One record per district/school year/student/program/report period
Student Course Enrollment Cube • Based on the Student Course Enrollment fact table • Provides unduplicated counts of students enrolled in classes, primary staff members teaching classes, and sections as well as other measures by various dimensions • Notes: • This cube includes data sourced from the Course Instructor, Staff Snapshot and Student Snapshot tables. If the corresponding records do not exist in these tables then the Student Course Enrollment records will not exist in this cube. • The volume of data in this cube is very large. Performance may be an issue, especially if using the # of Students measure. • Grain: One record per district/school year/location/course/section/student
School Enrollment Cube • Based on the School Enrollment fact table • Provides a count of the number of enrollment/withdrawal transactions, as well as unduplicated counts of students by various dimensions • Notes: • Report Period is not included in this cube since this is only an EOY collection • The student-related dimensions are sourced from the Student table, not Student Snapshot • Grain: One record per district/school year/student/enrollment date/enrollment code
Assessment Cube • Based on the Assessment Fact table • Provides NMSBA student average percent and numeric raw scores at the subtest (e.g., Math), cluster (e.g., Algebra) and skill (e.g., Algebraic Symbols) levels. It also provides an unduplicated count of students. • Grain: One record per district/student/school year/skill
Assessment Summary Cube • Same as the Assessment cube but with less detail. Performance is better for users who do not need the extra cluster and skill-level detail.
Challenges to using the Cubes • New STARS terms and structure may be unfamiliar • For example, staff positions now called staff assignments • Where do I find information on bilingual? • Understanding what cube to use • Data could be in multiple cubes • Not all STARS subject areas are included in a cube • Not all student related data is in the Student Snapshot cube • Understanding what you are counting • For example, what does the # of Program Enrollments mean? • Understanding when a measure is duplicated and when it is unduplicated; if duplicated, how is it duplicated • Key is to understand the grain, or lowest level of detail, in each cube
How do I get help with the cubes? • This presentation will be available on the STARS project web site: www.ped.state.nm.us/stars/documentation.html • Contact the STARS Help Desk
Exercise 1 • How many unduplicated students were enrolled in the BEP program for your district by location for 40th Day of SY 07-08? • Questions: • Which cube? • Which dimensions? • Which filters? • Which measure?
Exercise 2 • How many unduplicated students moved into your district from a school out of state, private school, home school or state-supported school by location by student ethnicity for SY 06-07? • Questions: • Which cube? • Which dimensions? • Which filters? • Which measures?
Exercise 3 • By years of experience range, how many unique primary instructors taught AP courses in which they were not highly qualified for SY 07-08? • Questions: • Which cube? • Which dimensions? • Which filters? • Which measures?