Download
1 / 49
500 likes | 519 Vues
Statistical Quality Control-QC Charts. Statistical process control.

E N D
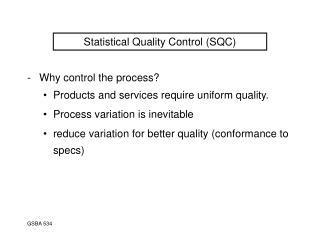
Statistical process control Statistical process control (SPC) is defined as the application of statistical techniques to control a process. SPC is concerned with quality of conformance. There are a number of tools available to the quality engineer that is effective for problem-solving process. The seven quality tools are relatively simple but very powerful tools which every quality engineer. The tools are: flow chart, run chart, process control chart, check sheet, pareto diagram, cause and effect diagram, and scatter diagram
Process Any activity or set of activities that takes inputs andcreate a product. For example: an industrial plant takesraw materials and creates a finished product.
3.2 Check sheets Check sheets are useful during data collection. They provide a simple means for recording data by categories and enable the analyst to determine the relative frequency of occurrence of the various categories of the data.
3.3 Cause and effect diagrams Cause and effect diagrams (CED) are simple techniques for dissecting a problem or a process. CED identifies all possible relationships among input and output variables, that is, the five categories on the following skeleton (materials, machines, man, methods, and environment).
3.1 Flow charts Flow charts are defined as the graphical representation of the steps of in a process. Flow charts facilitate an analysis of the steps in a process to determine relationships between the steps.
3.4 Histograms and pareto charts A histogram is a bar chart showing the variation or distribution of the observations from a set of data. The pareto chart is a form of bar chart with each bar representing a cause of a problem and always arranged so that the most influential cause of a problem can be easily recognized, that is, arranging the problems in descending order. This information is helpful in focusing attention on the highest-priority category (Srikaeo & Hourigan, 2002).
pareto charts Pareto analysis is a formal technique useful where many possible courses of action are competing for attention.
pareto charts This pattern is also called the ‘80/20 rule’ and shows itself in many ways. For example: • 80% of sales are generated by 20% of customers. • 80% of Quality costs are caused by 20% of the problems. • 20% of stock lines will account for 80% of the value of the stock
pareto charts Thistechniquehelpstoidentifythe top 20% of causesthatneedsto be addressedtoresolvethe 80% of theproblems.
History of Pareto Analysis TheParetoeffect is namedafterVilfredoPareto, an economistandsociologistwholivedfrom 1848 to 1923.
The Pareto Chart A Pareto chart is a graphical representation that displays data in order of priority.
This is a simple example of a Pareto diagram using sample data showing the relative frequency of causes for errors on websites. It enables you to see what 20% of cases are causing 80% of the problems and where efforts should be focused to achieve the greatest improvement.
3.5 Scatter diagrams Scatter diagramming is a tool to study how different variables relate to each other or how they correlate. A scatter diagram demonstrates the results of a series of experiments which is conducted to document the relationship between the variables. Table 4. represents the mathematical models.
3.6 Process control charts The primary function of a control chart is to determine which type of variation is present and whether adjustments need to be made to the process. Variables data are those data which can be measured on a continuous scale. Variable data are plotted on a combination of two charts- usually an x-bar (x) chart and a range (R) chart. The x-bar chart plots sample means. It is a measure of between-sample variation and is used to asses the centering and long term variation of the process.
3.6 Process control charts The range chart measure the within sample variation and asses the short term variation of the process Attribute charting is used for various types of defects, primarily by counting the number of nonconforming units or the nonconformities per units. The most commonly used attribute control chart is p-chart or the percentage of defective unit with variable sample size. The npchart is used to monitor the percentage defective unit for constant sample size. The c-chart is used to monitor the number of defects on an item for constant sample size. The u-chart is fro number of unlimited defects in variable sample size.
SQC can be divided into three categories 1- Descriptive statistics That is used to describe quality characteristics and their relationship Includes: 1)- Mean, 2)- SD, 3)- Range, 4)- Measure of distribution of data
Division of SQC 2- Statistical process control (SPC) Involves inspection of a random sample of an output of a process and deciding whether process is producing products within the predetermined range of characteristics 3-Acceptance sampling It is a process of randomly inspecting a sample of a goods and deciding whether to accept or reject the entire lot based on the results
Controlled Variation The variation that you can never eliminate totally. There are many small, unobservable chance effects that influence the outcome. This kind of variation is said to be "in control" not because the operator is able to control the factors absolutely, but rather because the variation is the result of normal disturbances, called common causes, within a process. This type of variation can be predicted. In other words, given the limitations of the process, these common causes are controlled to the greatest extent possible.
Uncontrolled Variation Variation that arise at irregular intervals and for which reasons are outside the normal functioning process, induced by a special cause. Special causes include differences between machines, different skill or concentration levels of workers, changes in atmospheric conditions, and variation in the quality of inputs. Unlike controlled variation, uncontrolled variation can be reduced by eliminating its special cause.
Control Charts As long as the points remain between the lower and uppercontrollimits, we assume that the observed variation iscontrolledvariation and that the process is in control
Control Chart. • Control chart is graphical representation of the collected information. • It pertains to the measured or otherwise judged quality characteristics of the items or samples.
What Do thEsE Charts Do. • It detects variations in the processing and warns if there is any departure from the specified tolerance limits. • It is primarily a diagnostic technique. • It depicts whether there is any change on the characteristics of items since the start of the production run.
PurPosEanDaDvantagEs. 1. A control chart indicates whether a process is in control or out of control. 2. It determines processes variability and detects unusual variations taking place in a process. 3. It ensures product quality level. 4. It warns in time and if the process is rectified in time scrap percentage can be reduced.
ComParIson of varIablEanDattrIbutE Chart. 1. Variable charts involve the measurement of the job dimensions whereas an attribute chart only differentiates between a defective item and a non-defective item. 2. Variable charts are more detailed and contain more information as compared to attribute charts. 3. Attribute charts is based on ‘GO and NO GO’ data require comparatively bigger sample size. 4. Variables charts are expensive.
X-bar chart. 1. It shows changes in process and is affected by changes in process variability. 2. It is a chart for the measure of central tendency. 3. It shows erratic or cyclic shifts in the process. 4. It detects steady progress changes, like tool wear. 5. It is most commonly used variables chart.
R-bar chart. 1. It controls general variability of the process andis affected by changes in process variability. 2. It is a chart for measure of spread. 3. It is used generally along with X-bar chart.
Control Chart Other types of suspicious patterns may appear in control charts Control chart makes it very easy to identify visually points and processes that are out of control without using complicated statistical tests This makes the control chart an ideal tool for the quick and easy quality control
Variable and Attribute Charts Categories of control charts: that monitor variables and that monitor attributes. Variable charts display continuous measurements such as weight, diameter, thickness, purity and temperature. Its statistical analysis focuses on the mean values of such measures. Attribute charts differ from variable charts in that they describe a feature of the process rather than a continuous variable. Attributes can be either discrete quantities, such as the number of defects in a sample, or proportions, such as the percentage of defects per lot.
Fishcanning Records should be simple to complete, so as not to discourage their use, and easy to interpret. In some cases it may be appropriate to record data on a quality control chart which shows the change in some variable against time (e.g., fill weight, as in Figure 4). The scales can be chosen to show the change in values about the target value and also include permissible maxima and minima (i.e., tolerances); action levels can be included to alert operators of trends that may cause production to move out of control. Quality control charts are well suited to continuous operations where monitoring takes place throughout production, they are less frequently used when the function being evaluated is a batch operation.
Fishcanning Figure 4 Quality control chart for recording container fill weight
A case study: Some applications of SPC in traditional sucuk processing A traditional sucuk processing was partly investigated by SPC. The process data were retrieved from an industry and analyzed by SPC techniques. Data were obtained over a period of 3 months. The process variables considered were and moisture content, pH change during ripening. In addition to these, some and product variables (flavor, texture, saltiness etc.) were determined from a survey conducted in Gaziantep, Turkey. The SPC techniques included Check sheets, Cause and effect diagrams, Histograms and pareto charts, Scatter diagrams, Process control charts, Failure mode and effect analysis
A case study: Some applications of SPC in traditional sucuk processing
4.1 Traditional sucukprocessing Sucukdough is prepared from meat (about 18% fat) mixed with tail fat, salt, sugar, cleandry garlic, spices, NaNO2, NaNO3, vegetable oil (generally olive oil), antioxidants andantimicrobial. Meat, fat and spices are added into sucuk dough according to the followingrecipe; 900 g sheep red meat (about 18% fat), 200 g tail fat, 5.5 g cumin, 1.1 g cinnamon, 11.42g allspice, 0.48 g cloves, 5.5 g red pepper, 11 g black pepper, 20.76 g garlic, 4.4 g sugar, 18 gsaltand 2.1 g olive oil are used to prepare sausage dough. A flow-chart of sucukpreparationisgiven in Figure 3. The meat is minced in a meat mincer to about 1.3–2.5 cm. After thatspicesand starter culture are added and mixed with minced meat. Starter culture mixture(P. acidilactici, L. plantarumand S.carnosus) is used as a 20 g commercial culture mixture per100 kg meat. After that nitrate/nitrite, potassium pyrophosphate, dipotassium hydrogen
4.1 Traditional sucuk processing phosphate, ascorbic acid and potassium sorbate which are dissolved in 25 ml of distilledwater, are added into the prepared of sucuk dough. The sucuk dough is conditioned at 0-4°C for 12 hours. The minced refrigerated tail fat is added and mixed into the sucukdough.Afterthat, the dough is filled into artificial collagen casings, of 38 mm diameter, underasepticconditions, using a fillingmachine. Sucuks are fermented and matured from 95% to60% RH and from 22 to 18 °C during 15 days. Sucuk samples are then stored at 50% RH and30 °C
4.2 Application of pareto analysis in traditional sucuk processing A survey study was done to collect customer complaints about the properties of sucuk products. According to Pareto analysis; the percentage of complaints are listed by the descending order and cumulative percentages are obtained by adding each other to previous ones. The priority problems are being identified by this order.
4.3 Application of control charts in traditional sucuk processing The amount of moisture in the production of sucuk is one of the quality parameters. Moisture content should be around 40%. The X-bar (x) and R-chart graphics in Table 7 are created from the moisture contents of 5 samples of 10 runs. The control limits drawn in both plots were obtained by using equations given in Table 5.