Download
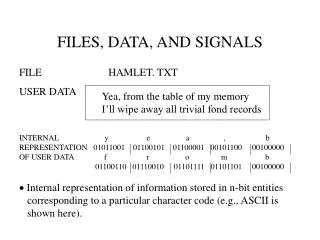
1 / 52
520 likes | 691 Vues
Signals and Trends in Borehole Strainmeter Data. Strainmeter Short Course 2009 Earthscope Meeting, Boise May 12, 2009. Signals and Trends. State of borehole compression Earth tides Barometric pressure response Seismic signals Non-tectonic signals Strain transients. Trends: Borehole.

E N D
Signals and Trendsin Borehole Strainmeter Data Strainmeter Short Course 2009 Earthscope Meeting, Boise May 12, 2009
Signals and Trends • State of borehole compression • Earth tides • Barometric pressure response • Seismic signals • Non-tectonic signals • Strain transients
Trends: Borehole • Dominant signal over months is borehole relaxation. • Long term trend should be areal compression. CH0 120° 120° 30° 90° CH2 CH1 3 gauge areal strain = (CH0+CH1+CH2)/3
Trends: Borehole B087, Ford Ranch Extension +ve Digital Counts (x103) 21.3 Microstrain “Classic Trends” Compression -ve areal strain=(CH0+CH2+CH3)/3
Trends: Borehole B087, Ford Ranch Extension +ve Digital Counts (x103) 0.4 Microstrain Compression -ve
Network State of Compression PBO BSM Network, Compression Rate Extension +ve 74% in compression Extension +ve Compression Rate (nanostrain/day) Compression -ve December 15, 2008 - April 15, 2009 Compression -ve Days since installation
Extension and steps GTSM21 designed to operate under compression 147.3 Microstrain Digital Counts (x103) B040 , York, Northern California
Extension and steps More likely to see steps in non-compressional BSM 16.6 Microstrain Digital Counts (x103) 21% of BSMs record steps 58% of non compressional BSMs record steps B040 , York, Northern California
Extension and steps Rate of steps decrease as BSM turns to compression 2.7 Microstrain Digital Counts Digital Counts (x103) B040 , York, Northern California
Extension and steps B010, PGC, Vancouver Island, Canada B010 250m Source of step unknown: Nothing on other gauges Nothing on B009 or B011 Digital Counts (x103) 16.8 Microstrain 168m B011 B009
Trends: Seasonal B009, PGC, Vancouver Island, Canada Digital Counts (x103) B009, PGC
Trends: Seasonal B009, PGC, Vancouver Island, Canada microstrain Herb Dragert reports farmer irrigating fields B009, PGC
Hydrostatic Coupling B006, Shores, Washington • Possibly hydrologically coupled • Little or no shear strain • Drifting phase in tidal signal • Little strain accumulated over 3.5 years 4.3 Microstrain Digital Counts (x103)
Tidal signal • Expect optimal performance in the tidal band • M2 and O1 peaks should be visible in the spectrum • Areal and shear consistency
CH0 CH1 microstrain CH2 CH3 Tidal signal B018, Delphi, Seattle, WA Detrended gauge data
Tidal signal B018 Delphi, Seattle, WA Band passed gauge data, 0.25 to 4 cpd (3 years) M2 O1 dB/cpd
Tidal Consistency CH0 120° 120° 120° 90° CH2 CH1 CH1 CH3 3 gauge areal strain (CH0+CH1+CH2)/3 2 gauge areal strain (CH1+CH3)/2
Areal ±10° 69% Shear ±10° 65% Areal ±25 44% Shear ±25% 65% Tidal Consistency M2 Amplitude Ratio M2 Phase Difference Strainmeters
CH0 CH1 microstrain CH2 CH3 Barometric Response Pressure increase = gauge compression B018, Delphi, Seattle, WA Tides removed mbar Barometric Pressure
CH0 CH1 microstrain CH2 CH3 Barometric Response Pressure increase = gauge compression B018, Delphi, Seattle, WA Tides & barometric response removed mbar Barometric Pressure
Barometric Response Average barometric response coefficients Olympic P. OR N.C Parkfield Anza MSH YS Mojave Strainmeters • Typical Range 2-10 nanostrain/millibar
High frequency signals B022 , May 31, 2008, 1-sps data Digital Counts (x106) 9-12 second calibration signal, 30 minutes past the hour Null point before and after signal
High frequency signals B022 , May 31, 2008, 1-sps data Digital Counts
B022 Spectrogram, May 31, 2008 M6.6 Mid Indian Ridge CH0 Microseism CH1 B006 CH2 Calibration spikes CH3
Olympic Peninsula: Seismic Shear M7.6 Tonga, March 19, 2009 March 19, 2009
Noise: Rainfall • Several of the PBO BSMs show strain signals correlated with rainfall • When looking at transients check the rainfall measurements, all PBO sites have rain gauges
Noise: B022 Rainfall B022, Oregon Coast B022, Seaside, Oregon Coast Digital Counts Site in river flood plain, prone to flooding Rainfall (mm/hr)
Noise: Pathfinder, Anza Co-located, Pathfinder strainmeters Microstrain B082 CH0CH1CH2CH3 Microstrain B089
Noise: Pathfinder, Anza Co-located, Pathfinder strainmeters Microstrain B082 Microstrain B089
Noise: B001 Pumping B001, Golbeck, Washington 0.1 Microstrain Digital Counts 2 gauges compression 2 gauge in extension PNW: B001 B045 Anza: B082 B089 B088
Noise: Storms B012, Ucluelet, Vancouver Island, Canada Digital Counts (x103) February 4, 2006 February 4, 2006 February 5, 2006
Noise: Downhole Temperature B022, Seaside, Portland Increase in downhole temperature => compression Digital Counts (x103) Counts Temperature °C Downhole Temperature
Noise: Downhole Temperature B012 restart, February 11, 2009 Instrument restart Increase in downhole temperature => compression Digital Counts (x103) Temperature °C Downhole Temperature
Solar Noise • Noise is introduced when solar panels start to charge up in early morning. • Visible in the 1 and 20-sps data set. • PBO engineers found that rerouting cables helped.
Solar Noise: 1 sps B916, Mojave, March 20, 2008 B058 2009:083 1sps Spectrum CH0 CH1 CH2 CH3
Solar Noise: 20 sps B916, Mojave, March 25, 2008 CH0 CH1 CH2 CH3
Cascadia Episodic Tremor and Slip A Strain Transient: Cascadia ETS B009 B012 B004 B005-7 B001 B003
Cascadia Episodic Tremor and Slip A Strain Transient: Cascadia ETS B009 B012 B004 B005-7 B001 B003 2Ene Strain Eee-Enn B004, Hoko Falls, WA B018
Cascadia Episodic Tremor and Slip 2Ene Strain microstrain 2007 Tremor B004 2Ene Strain microstrain Eee-Enn 2005 Tremor B004
Cascadia Episodic Tremor and Slip 2Ene Strain microstrain B004 2008 Tremor
Spring 2008 Cascadia ETS Pacific Northwest BSMs: Shear strain May 31 B012 B009 May 15 B004 B005-7 B001 microstrain B003 propagation of tremor (www.pnsn.org) May 4 B018 April 2008 May 2008
2009 Cascadia ETS ? Pacific Northwest BSMs: Shear strain B012 B009 B004 B005-7 B001 microstrain B003 B018 April 2009 May 2009
ETS March 2009, B012, Vancouver Island B012, Ucluelet, March 2009: Processed Gauge Data microstrain Detrended gauge data Tide removed Tide and pressure removed
ETS March 2009, B012, Vancouver Island Tensor Strain microstrain Detrended gauge data Tide removed Tide & pressure removed
Creep Events, Parkfield Middle Mountain Area, Parkfield PBO-BSM PBO-BSM
B073 Varian, Parkfield 2Ene Strain Eee-Enn Creep Events, Parkfield Middle Mountain Area, Parkfield PBO-BSM PBO-BSM microstrain Right lateral creep events
Creep Events, Parkfield B073 Varian, Parkfield 1-sps Gauge Data