Download
1 / 14
140 likes | 144 Vues
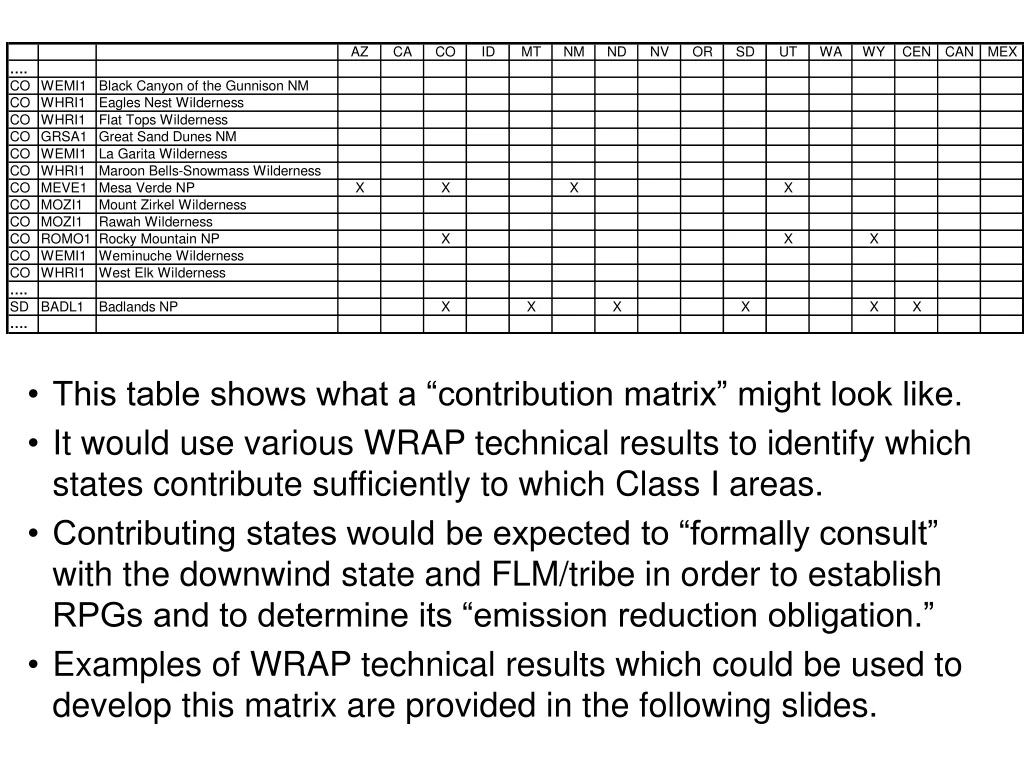
This table shows how different states contribute to air pollution in specific Class I areas. It uses technical results to establish emission reduction obligations and consult with downwind states and FLM/tribe. Examples of technical results are provided.

E N D
This table shows what a “contribution matrix” might look like. • It would use various WRAP technical results to identify which states contribute sufficiently to which Class I areas. • Contributing states would be expected to “formally consult” with the downwind state and FLM/tribe in order to establish RPGs and to determine its “emission reduction obligation.” • Examples of WRAP technical results which could be used to develop this matrix are provided in the following slides.
Upwind Contributing StatesBased on CAMx/PSAT Model Results for SO4 and NO3The following slides use outdatedmodeling results and are presentedfor illustration purposes only.
Rocky Mountain SO4 Modeled Attribution
Rocky Mountain NO3 Modeled Attribution ?
Mesa Verde SO4 Modeled Attribution
Mesa Verde NO3 Modeled Attribution ?
Modeled SO4 Extinction Attributed to WRAP States Contributions from UT, WY, and areas outside the WRAP not included.
Upwind Contributing StatesBased on Back Wind Trajectory Regression Results for SO4
Rocky Mountain SO4 Trajectory Regression ? ?
Mesa Verde SO4 Trajectory Regression
Upwind Contributing StatesBased on Weighted EmissionPotential for Dust and Carbon
2002 Weighted Emission Potential of Coarse Mass Sources at Badlands
2002 Weighted Emission Potential of Primary Organic Carbon Sources at Sawtooth