Download
1 / 25
260 likes | 409 Vues
Remote Sensing Hyperspectral Imagery April 1 st , 2004 Stefan A. Robila robilas@mail.montclair.edu www.csam.montclair.edu/~robila/RSL/. Source: http://nis-www.lanl.gov/~borel/. Increasing Wavelength (in meters). 10 -6 Infrared. 10 -11 Gamma Rays. 10 -8 Ultraviolet. 10 Radio.

E N D
Remote Sensing Hyperspectral Imagery April 1st, 2004 Stefan A. Robila robilas@mail.montclair.edu www.csam.montclair.edu/~robila/RSL/ Source: http://nis-www.lanl.gov/~borel/
Increasing Wavelength (in meters) 10 -6 Infrared 10 -11 Gamma Rays 10 -8 Ultraviolet 10 Radio X-Rays 10 -9 Visible 10 -7 Microwaves 10 -2 Electromagnetic Spectrum Hyperspectral Remote Sensing • a remote sensing technology • “seeing” characteristics not recognized by the human eye
Hyperspectral Remote Sensing Non-Imaging Instruments (example: FieldSpec Hand Held Spectroradiometer) • sensor obtains data (amount of light per wavelength) • computer software displays recorded spectrum • analyze spectral signature
Imaging systems • Scanning radiometers • Passive system • Produces digital images
Imaging systems Scanning radiometers Mirror scans across-track (swath)
Imaging Systems Scanning radiometers 2-D image formed by platform forward motion
CCD • CCD arrays • Passive system • Line or block of CCDs instead of scanning mirror • Senses entire swath (or block) simultaneously
Hyperspectral Remote Sensing Multispectral – Many spectra (bands) Hyperspectral – Huge numbers of continuous bands Hyperspectral remote sensing provides a continuous, essentially complete record of spectral responses of materials over the wavelengths considered.
Hyperspectral Platforms First hyperspectral scanners: 1982: AIS (Airborne Imaging Spectrometer) 1987: AVIRIS (Airborne Visible/infrared Imaging Spectrometer) 1995: Hyperspectral Digital Imagery Collection Experiment (HYDICE) 2000: Hyperion (EO-1)
AVIRIS Specifications • 224 individual CCD (charge coupled device) detectors • Spectral resolution of 10 nanometers • Spatial resolution of 20 meters (at typical flight altitude) • Flight platform: NASA ER-2 (modified U-2) • Flight altitude: from 20,000 to 60,000, but usually flown at 60,000 • Typical swath width is 11 km. • Dispersion of the spectrum against the detector array is accomplished with a diffraction grating. • The total interval reaches from 380 to 2500 nanometers (roughly the same as TM band range). • image, pushbroom-like, succession of lines, each containing 664 pixels.
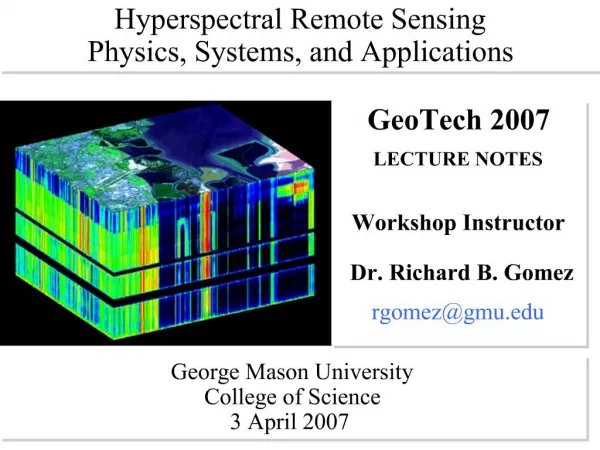
Hyperspectral Cube • shows the volume of data returned by imaging instruments • illustrates how data from imaging instruments is geo-referenced • data from different wavelengths can be used to create a “map” (in either true color or false color infrared formats)
Hyperspectral Remote Sensing Hyperspectral images can be analyzed in ways that multispectral images cannot In the Visible-NIR range, water ice and dry ice give characteristic spectral curves, as shown here:
Hyperspectral Data Analysis • General Approach: • Develop Spectral Library • Construct spectral curve for relatively "pure" materials • Specific reflectance peaks and absorption troughs are read from these curves. • Compare to lab spectra (mixture analysis) • Mixtures of two or even three different materials can be identified as the components of the compound spectral curve.
Hyperspectral Data Analysis Spectral Libraries: Sets of hundreds of measured spectra for components likely to be encountered in the study area.
Spectral Angle The distance measure used for spectral screening. For two pixel vectors x and y, the spectral angle is computed as:
Hyperspectral Data Analysis • Pure Pixel Analysis • Find relatively “pure” pixels • Pixel Purity Index (PPI) • “Pure” spectra are spectral endmembers • Endmembers • Spectral characteristics of an image that represent classes of interest • Usually assigned based on lab spectra • Can be done manually
Hyperspectral Data Analysis • Spectral Mixture Analysis (SMA) • Also called “unmixing” • Assumes that the reflectance spectrum derived from sensor can be deconvolved into a linear mixture of the spectra of ground components • Linear / Non-linear • Linear SMA assumes linear relationship between reflectance and area
Linear Mixture Model • Each pixel vector x can be described as: • whereS is the nxm matrix of spectra (s1, .., sm) of the individual materials (also called endmembers), a is an m-dimensional abundance vector and w is the additive noise vector. • The abundances of the endmembers have the restrictions: • The ICA performs endmember unmixing; the resulting components correspond to the abundances of the endmembers, the columns in the mixing matrix correspond to the endmembers.
Future Hyperspectral Sensors • Spaceborne rather than airborne • Success: • Hyperion, is part of NASA’s EO-1 - launched in December, 2000. • Co-orbiting with Landsat 7 • 220 channels from 400 to 2500 nm • Ground resolution 30 meters.
Future Hyperspectral Sensors Hyperion
Future Hyperspectral Sensors • Off-the shelf (reduce costs) • Success: SOC 700 (Surface Optics) • Spectral Band: 0.43 –to 0.9 microns • Number of Bands: 120, 240 or 480 (configurable) • Dynamic Range: 12-bit • Line Rate: Up to 100 lines/second (120 bands) • Pixels per line: 640 • Exposure Time: 10 -> 10^7 microsecond
Hyperspectral Problems • Data volume • Cost • Difficulty of analysis • Spectral Libraries • More complex