Download
1 / 27
270 likes | 484 Vues
Indicator Variables. Response: Highway MPG Explanatory: 2 explanatory variables Indicator variables for types of drive – All Wheel, Rear Wheel, and Front Wheel. All Wheel Indicator. All Wheel = 1 if the vehicle has all wheel drive. All Wheel = 0 if the vehicle does not have all wheel drive.

E N D
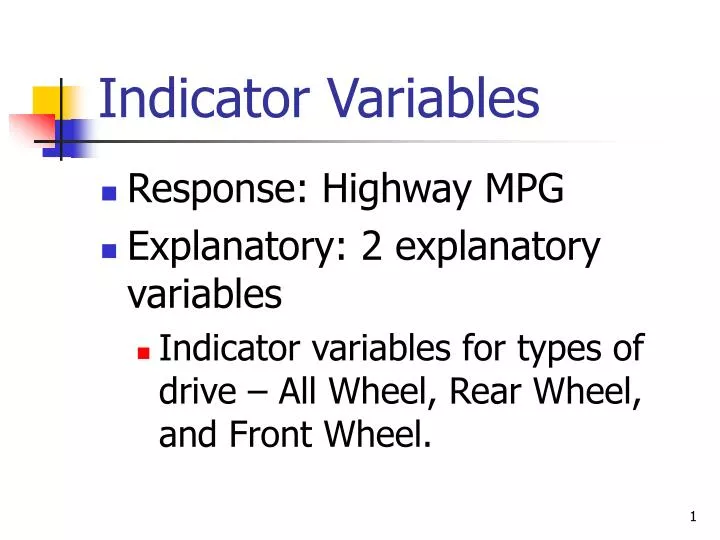
Indicator Variables • Response: Highway MPG • Explanatory: 2 explanatory variables • Indicator variables for types of drive – All Wheel, Rear Wheel, and Front Wheel.
All Wheel Indicator • All Wheel = 1 if the vehicle has all wheel drive. • All Wheel = 0 if the vehicle does not have all wheel drive.
Rear Wheel Indicator • Rear Wheel = 1 if the vehicle has rear wheel drive. • Rear Wheel = 0 if the vehicle does not have rear wheel drive.
Front Wheel Indicator • There is no need for a separate indicator variable for front wheel drive. • If All Wheel = 0 and Rear Wheel = 0, then the vehicle has front wheel drive.
Multiple Regression • Fit a multiple regression model with the two indicator variables as the explanatory variables and Highway MPG as the response.
Prediction Equation Predicted Highway MPG = 29.983 – 7.375*All Wheel – 3.454*Rear Wheel
Summary • R2 = 0.254 • adj R2 = 0.239 • RMSE = 5.312 • Model is useful. F = 16.5224, P-value < 0.0001
Interpretation • Estimated intercept: When All Wheel = 0 and Rear Wheel = 0 the predicted Highway MPG is 29.983. • The average Highway MPG for front wheel drive cars is 29.983.
Interpretation • Estimated slope for All Wheel: Holding Rear Wheel = 0, if you change All Wheel from 0 to 1 you are comparing the Front Wheel drive to the All Wheel drive. • An All Wheel drive vehicle gets, on average, 7.375 mpg less than a Front Wheel drive vehicle.
Interpretation • Estimated slope for Rear Wheel: Holding All Wheel = 0, if you change Rear Wheel from 0 to 1 you are comparing the Front Wheel drive to the Rear Wheel drive. • A Rear Wheel drive vehicle gets, on average, 3.454 mpg less than a Front Wheel drive vehicle.
Comparisons • Are the differences between All Wheel and Front Wheel and Rear Wheel and Front Wheel statistically significant?
Comparison • All Wheel to Front Wheel. • Difference in average Highway mpg is 7.375. • t = –5.66, F = 32.05 • P-value < 0.0001 • The difference is statistically significant because the P-value is so small.
Comparison • Rear Wheel to Front Wheel. • Difference in average Highway mpg is 3.454. • t = –2.37, F = 5.60 • P-value < 0.0199 • The difference is statistically significant because the P-value is so small.
Comparison • All Wheel to Rear Wheel. • This comparison is not considered in the JMP output. • However, there is enough information to figure it out.
Predictions • All Wheel: Predicted Highway MPG = 29.983 – 7.375 = 22.608 • Rear Wheel: Predicted Highway MPG = 29.983 – 3.454 = 26.529
Comparison • All Wheel to Rear Wheel. • Difference in average Highway mpg is 22.608 – 26.529 = –3.921 • Is this difference statistically significant?
Test of Significance • Difference in means
Comparison • All Wheel to Rear Wheel
Comparison • All Wheel to Rear Wheel. • Difference in average Highway mpg is 3.921. • t = –2.31, F = 5.33 • P-value = 0.0231 • The difference is statistically significant because the P-value is so small (< 0.05).
Residuals vs. Predicted • The predicted values correspond to the three types of drive; All Wheel, Rear Wheel and Front Wheel. • Front Wheel drive vehicles show more variation than the other types of drives.
Interpretation • Histogram: Mounded to the left of zero and skewed to the right. • Box Plot: Skewed right with one potential outlier on the negative side and several potential outliers on the positive side.
Interpretation • Normal Quantile Plot: the points start off following the red diagonal (normal model) line but then dip below, curve above and dip below. This indicates a skewed right distribution.
Conditions? • Equal standard deviation condition may not be met. • Identically distributed condition may not be met. • Normally distributed condition may not be met.


![[indicator title]](https://cdn3.slideserve.com/6127120/slide1-dt.jpg)