Download
1 / 27
340 likes | 678 Vues
Indicator Matrix. A Tool to Monitor Local Level SPF SIG Activities . History of the Indicator Matrix. Developed by the SPF SIG Statewide Epidemiology Workgroup. Based on the review of all SPF SIG community strategic plans.

E N D
Indicator Matrix A Tool to Monitor Local Level SPF SIG Activities
History of the Indicator Matrix • Developed by the SPF SIG Statewide Epidemiology Workgroup. • Based on the review of all SPF SIG community strategic plans. • Goal is to assist communities with local level data and strategy monitoring.
Course Overview • Agenda • House Keeping
Training Work Agreement What behaviors can we all agree to do to make this training enjoyable for everyone attending?
Indicator Matrix Training Objectives • Define the term “indicator”. • Explain process and outcome measures. • Describe the relationship between contributing factors and outcomes. • Explain how to use the Indicator Matrix to identify local process and outcome measures.
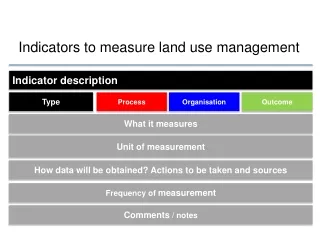
Indicators • The factor, variable, or observation that will be used to determine that an immediate or direct effect of a program has occurred. (Getting to Outcomes) • A numerical measure of a quality or characteristic of some aspect of a program; evidence that something is occurring, that progress is being made. (http://sanctuaries.noaa.gov/education/evaluation/glossary.html)
Indicators • Is the unit of measurement (or pointers) that is used to monitor or evaluate the achievement of project objectives over time. Indicators can include specification of quantifiable targets and measures of quality. (http://www.cardnoacil.com/glossary.htm)
Indicators • Ways of quantifying objectives: for example, road accident numbers are one indicator of safety (http://www.konsult.leeds.ac.uk/public/level1/sec17/index.htm) • Established quantifiable objective measures • There are both process and outcome indicators
Indicators Activity • In a small group, review the “Is This an Indicator?” worksheet. • Decide if the statement is an indicator. If it is, put an “X” on the line next to it. • Review as a larger group.
Indicators-Activity 2 • In a small group, without looking at the Indicator Matrix, list 5 indicators your SPF SIG project would monitor. • 4 minutes. • We will review as a large group
Long Term Outcomes • Consumption Measures and Risk Behaviors are Long Term Outcomes (see first two pages of the Indicator Matrix). • Long-Term outcomes (also known as impacts): Changes that occur as a result of many interventions. Long-term outcomes are likely to be changes in behaviors, conditions (e.g., risk factors and status (e.g., poverty rates). (Getting to Outcomes) • Each Long-Term outcome has indicators communities and the state can use to measure the success of efforts.
SPF • Key is a data driven process. • Strategies are identified based on local data (aka contributing factors). • Local data will help monitor the effectiveness of the strategies.
Process evaluation • Assessing what activities were implemented, the quality of the implementation, and the strengths and weaknesses of the implementation. Process evaluation is used to produce useful feedback for program refinement, to determine which activities were more successful than others, to document successful processes for future replication, and to demonstrate program activities before demonstrating outcomes. Chinman, M., Imm, P., Wandersman, A.. (2004). Getting to Outcomes: Promoting Accountability Through Methods and Tools for Planning, Implementation, and Evaluation. Rand, Santa Monica.
Process Measures/Indicators • Indicators that the intended process or plan is “on track.” One process indicator showing success in developing a collaborative effort may be the development of an interagency agreement. (Getting to Outcomes)
Process Measures • Documentation of staff time, resources invested in delivering strategy, and counting the number of services delivered. • Quantitative and Qualitative • Examines the effort required to implement programs, practices, and policies. • Documenting process of strategies helps identify what did or did not produce results. Hawkins, D.J. &Nederhood, B.. (1987). Handbook for Evaluating Drug and Alcohol Prevention Programs: Staff/Team Evalution of Prevention Programs (STEPP). U.S Department of Health and Human Services.
Outcomes • Immediate results or long term results associated with strategies. • Outcomes determine the effectiveness of strategies. • An immediate or direct effect of a program; outcomes are frequently stated, by a specified date, there will be a change (increase or decrease) in the target behavior, among the target population. (Getting to Outcomes)
Identifying Process Measures- Activity • Select 1 strategy your SPF SIG is implementing. • Fill out the following sections of the “Process Measures/Indicator Worksheet”: • Strategy • Activities (Make sure to list each activity) • Process Measures (use the indicator matrix and list any that may not be on the worksheet) • You will have 15 minutes. • We will discuss as a large group.
Identifying Outcome Indicators- Activity • Using the Indicator Matrix, identify Local Level Outcome Indicators for your strategy. • You will have 10 minutes. • We will review as a large group.
Using Process and Outcome Indicators to Monitor Your Project • Identifying the Local Level Outcome Indicators and monitoring them is crucial to the success of your project. • If you are not achieving these immediate outcomes, you will most likely not to be able to achieve long-term outcomes. These strategies should be addressed and a decision to modify them, continue them, or change strategies needs to be made. • Use your process measures to evaluate the effectiveness of your strategies.
Monitoring Data Using the Indicator Matrix • Local Epi Workgroups can use the Indicator Matrix as a guide for the data that needs to be collected. • Process measures will be collected and stored by the SPF SIG project. • Local Level Outcomes require collaboration in the community and assist in identifying what data the local epi workgroup needs to collect and from whom.
Identifying Data Sources and Partners • On your “NM SPF SIG Key Indicators” worksheet identify the following: • Local level outcomes your SPF SIG project needs to collect based on all of your strategies. • Local data sources • Partners (agencies or specific people)
Monitoring Local Level Data • Identify 1 outcome from your strategies and create a poster for the group that illustrates: • The outcome • Your data source • How will you monitor it over time? (Will you put the data into a table, chart, graph, maps, etc.) • Your poster will be shared with the entire group.
Objectives Define the term “indicator”. Explain process and outcome measures. Describe the relationship between contributing factors and outcomes. Explain how to use the Indicator Matrix to identify local process and outcome measures. 3/13/09
Questions or Comments? Please fill out your evaluations and leave them on your table.