Download
1 / 41
410 likes | 492 Vues
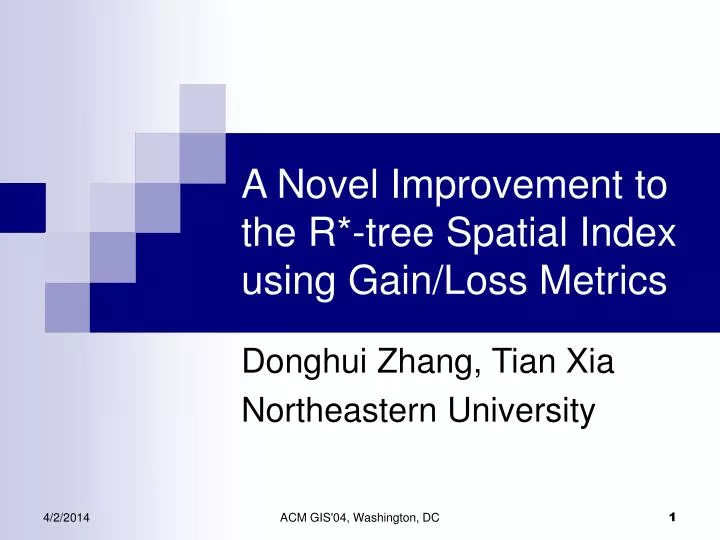
A Novel Improvement to the R*-tree Spatial Index using Gain/Loss Metrics. Donghui Zhang, Tian Xia Northeastern University. Outline. Background and motivation Definitions of some metrics Algorithm sketches Experimental results Conclusion and future works. P7. R4. R6. R5 R6.

E N D
A Novel Improvement to the R*-tree Spatial Index using Gain/Loss Metrics Donghui Zhang, Tian Xia Northeastern University ACM GIS'04, Washington, DC
Outline • Background and motivation • Definitions of some metrics • Algorithm sketches • Experimental results • Conclusion and future works ACM GIS'04, Washington, DC
P7 R4 R6 R5 R6 R3 R4 P8 P6 P1 R3 R1 R2 R1 P5 P2 P3 R5 P1 P2 P3 P4 P5 P6 P7 P8 R2 P4 The R*-tree ACM GIS'04, Washington, DC
Forced reinsertion in the R*-tree b a 7 d 5 c ACM GIS'04, Washington, DC
Two goals • Reduce the MBR area. • Keep the shape of the MBR close to a square. • Rationale: The tree is likely to have less overlap, therefore improves the range query performance. • Observation: R*-tree’s action of picking objects can be improved. ACM GIS'04, Washington, DC
A better choice b a 7 d 5 c ACM GIS'04, Washington, DC
Outline • Background and motivation • Definitions of some metrics • Quality / Gain / Loss • p-boundary / minP-boundary • Algorithm sketches • Experimental results • Conclusion and future works ACM GIS'04, Washington, DC
Three constraints • With same areas, the quality of a square is larger than a rectangle. • With same shapes, the quality of a smaller rectangle is larger than a bigger rectangle. • A rectangle is shrunk to another rectangle, the quality always increases. ACM GIS'04, Washington, DC
, [0,1], e.g. 0.5 Quality • Definition: Given a rectangle r with width w and height h, the quality of r is ACM GIS'04, Washington, DC
0.25 1 0.5 0.5 1 1 Q=1 Q=2 Q=4 Quality (example) Given = 0.5, ACM GIS'04, Washington, DC
Extension to d dimensions • Given a d-dimensional rectangle r, whose edges have length h1,…,hd, the quality of r is ACM GIS'04, Washington, DC
Gain / Loss • Definition: the gain of shrinking rectangle r1 to r2is • Symmetrically, the loss of expanding r2 to r1 is defined as the gain of shrinking r1 to r2. ACM GIS'04, Washington, DC
Extension to a set of objects • The quality of S is the quality of MBR(S). • The gain of removing a subset P from S, is the gain of shrinking MBR(S) to MBR(S-P). ACM GIS'04, Washington, DC
Outline • Background and motivation • Definitions of some metrics • Quality / Gain / Loss • p-boundary and minP-boundary • Algorithm sketches • Experimental results • Conclusion and future works ACM GIS'04, Washington, DC
b a d c p-boundary • If a page overflows, p objects will be removed from the page. • The p-boundary is the optimal set of such p objects, which achieve the largest gain Gp. ACM GIS'04, Washington, DC
e e d f d f c c minP-boundary • Given a threshold b (e.g. 0.8), minP-boundary is the smallest set which achieves gain no less than b Gp. ACM GIS'04, Washington, DC
Modifications on the R*-tree • The forced reinsertion algorithm picks the minP-boundary to re-insert. • Reinsertion is not always enforced. • Apply Gain/Loss metrics on the process of choosing a subtree to accommodate a new entry. ACM GIS'04, Washington, DC
Outline • Background and motivation • Definitions of some metrics • Algorithm sketches • Experimental results • Conclusion and future works ACM GIS'04, Washington, DC
Straightforward solution 1 • Enumerate all possible combinations of p objects in a page. • The number of combinations is , which can be exponential in n. ACM GIS'04, Washington, DC
a b c d f g e i j h k l Straightforward solution 2 • Enumerate all possible combinations among outside objects. • The number of combinations could be exponential in p. p = 2 only a, b, d, e, l and k may appear in the p-boundary. ACM GIS'04, Washington, DC
25 a b c 24 d 23 e f g 22 h i j k 21 l 20 5 6 7 8 9 10 Our idea • Shrink the borders by levels. • How to store the levels s.t. we can efficiently find and remove one level? ACM GIS'04, Washington, DC
Outline • Background and motivation • Definitions of some metrics • Algorithm sketches • Border structure • Exhaustive algorithms • Greedy algorithms • Experimental results • Conclusion and future works ACM GIS'04, Washington, DC
25 TOP LEFT RIGHT BOTTOM a b c a, b e d l 24 d 23 e f g c, d a, h b, k k 22 h i j k 21 a b c d e h k l l 20 5 6 7 8 9 10 Border structure p = 4 LX=[5,6,7], LY=[20,21,22], HX=[10,9,8], HY=[25,24,23] ACM GIS'04, Washington, DC
Outline • Background and motivation • Definitions of some metrics • Algorithm sketches • Border structure • Exhaustive algorithms • Greedy algorithms • Experimental results • Conclusion and future works ACM GIS'04, Washington, DC
25 a b c 24 d 23 e f g 22 h i j k 21 l 20 5 6 7 8 9 10 Exhaustive search of p-boundary (Algorithm pick-p) • Shrink the borders by levels. LX=[5,6,7], LY=[20,21,22], HX=[10,9,8], HY=[25,24,23] ACM GIS'04, Washington, DC
Exhaustive search of p-boundary (Algorithm pick-p) • A rectangle is valid if: • No more than p objects outside; • it is an MBR of all the objects inside; ACM GIS'04, Washington, DC
Exhaustive search of p-boundary (Algorithm pick-p) • Compute the gain of shrinking the original MBR to a valid rectangle, and keep the largest gain Gp and the corresponding combination. ACM GIS'04, Washington, DC
Exhaustive search of minP-boundary (Algorithm pick-minP) • To find optimal minP-boundary, store the intermediate results. • For each distinct gain, only keep the combination which removes the smallest number of objects. • At the end, choose the combination whose gain is the largest, no less than Gp. ACM GIS'04, Washington, DC
Outline • Background and motivation • Definitions of some metrics • Algorithm sketches • Border structure • Exhaustive algorithms • Greedy algorithms • Experimental results • Conclusion and future works ACM GIS'04, Washington, DC
Greedy algorithms • Idea: always pick the border which, if we remove one level, will result in the largest average gain per removed object. p = 2 d a b c ACM GIS'04, Washington, DC
Greedy algorithms • look-ahead: compute the average gains of removing 1,…, m levels, and pick the one with largest average gain. p = 3 ACM GIS'04, Washington, DC
Outline • Background and motivation • Definitions of some metrics • Algorithm sketches • Experimental results • Conclusion and future works ACM GIS'04, Washington, DC
Experiments – setup • Real datasets • the Postal dataset: 123,593 point data (postal addresses in Northeast area of USA). • the Street dataset: 131,461 line segments (streets of Los Angeles). • p = 30% of the node capacity (1KB). • a = 0.5, b = 0.9 and m = 5. ACM GIS'04, Washington, DC
Experiments – Gain comparison Comparison of gains under various number of objects Comparison of running time of various algorithms ACM GIS'04, Washington, DC
Experiments – Index construction 100000 20000 80000 16000 60000 12000 # Disk I/O # Disk I/O 40000 8000 20000 4000 0 0 Greedy Original Greedy Original the Postal dataset the Street dataset ACM GIS'04, Washington, DC
Experiments – Range query by varying query size Page size: 1K, buffer size: 128K. the Postal dataset the Street dataset ACM GIS'04, Washington, DC
Experiments – Range query by varying page size Query size: 0.01%, buffer size: 128K. the Postal dataset the Street dataset ACM GIS'04, Washington, DC
Experiments – Range query by varying buffer size Page size: 1K, Query size: 0.01%. the Postal dataset the Street dataset ACM GIS'04, Washington, DC
Outline • Background and motivation • Definitions of some metrics • Algorithm sketches • Experimental results • Conclusion and future works ACM GIS'04, Washington, DC
Conclusions and future work • Defined novel quality/gain/loss metrics, considering both area and shape. • Defined minP-boundary and proposed algorithms to find it. • Integrated with R*-tree and achieved up to 20% range query improvement. • Examining the idea to promote outlier objects to index nodes. ACM GIS'04, Washington, DC
Thank you! ACM GIS'04, Washington, DC