Download
1 / 1
10 likes | 132 Vues
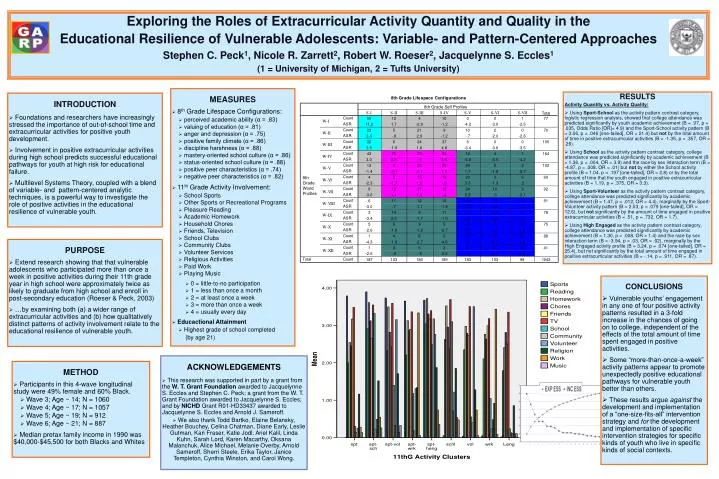
Exploring the Roles of Extracurricular Activity Quantity and Quality in the Educational Resilience of Vulnerable Adolescents: Variable- and Pattern-Centered Approaches Stephen C. Peck 1 , Nicole R. Zarrett 2 , Robert W. Roeser 2 , Jacquelynne S. Eccles 1

E N D
Exploring the Roles of Extracurricular Activity Quantity and Quality in the Educational Resilience of Vulnerable Adolescents: Variable- and Pattern-Centered Approaches Stephen C. Peck1, Nicole R. Zarrett2, Robert W. Roeser2, Jacquelynne S. Eccles1 (1 = University of Michigan,2 = Tufts University) MEASURES • 8th GradeLifespace Configurations: • perceived academic ability (α = .83) • valuing of education (α = .81) • anger and depression (α = .75) • positive family climate (α = .86) • discipline harshness (α = .88) • mastery-oriented school culture (α = .86) • status-oriented school culture (α = .88) • positive peer characteristics (α = .74) • negative peer characteristics (α = .82) • 11th GradeActivity Involvement: • School Sports • Other Sports or Recreational Programs • Pleasure Reading • Academic Homework • Household Chores • Friends, Television • School Clubs • Community Clubs • Volunteer Services • Religious Activities • Paid Work • Playing Music • 0 = little-to-no participation • 1 = less than once a month • 2 = at least once a week • 3 = more than once a week • 4 = usually every day • Educactional Attainment • Highest grade of school completed (by age 21) • RESULTS • Activity Quantity vs. Activity Quality: • Using Sport-School as the activity pattern contrast category, logistic regression analysis, showed that college attendance was predicted significantly by youth academic achievement (B = .97, p = .035, Odds Ratio [OR]= 4.9) and the Sport-School activity pattern (B = 3.06, p = .046 [one-tailed], OR = 21.4) but not by the total amount of time in positive extracurricular activities (B = -1.35, p = .357, OR = .26). • Using School as the activity pattern contrast category, college attendance was predicted significantly by academic achievement (B = 1.36, p = .004, OR = 3.9) and the race by sex interaction term (B = -4.87, p = .008, OR = .01) but not by either the School activity profile (B = 1.04, p = .197 [one-tailed], OR = 2.8) or by the total amount of time that the youth engaged in positive extracurricular activities (B = 1.19, p = .375, OR = 3.3). • Using Sport-Volunteer as the activity pattern contrast category, college attendance was predicted significantly by academic achievement (B = 1.47, p = .012, OR = 4.4), marginally by the Sport-Volunteer activity pattern (B = 2.53, p = .079 [one-tailed], OR = 12.6), but not significantly by the amount of time engaged in positive extracurricular activities (B = .51, p = .732, OR = 1.7). • Using High Engaged as the activity pattern contrast category, college attendance was predicted significantly by academic achievement (B = 1.30, p = .008, OR = 1.4) and the race by sex interaction term (B = -3.94, p = .03, OR = .02), marginally by the High Engaged activity profile (B = 3.24, p = .074 [one-tailed], OR = 25.4), but not significantly by the total amount of time engaged in positive extracurricular activities (B = -.14, p = .911, OR = .87). INTRODUCTION • Foundations and researchers have increasingly stressed the importance of out-of-school time and extracurricular activities for positive youth development. • Involvement in positive extracurricular activities during high school predicts successful educational pathways for youth at high risk for educational failure. • Multilevel Systems Theory, coupled with a blend of variable- and pattern-centered analytic techniques, is a powerful way to investigate the role of positive activities in the educational resilience of vulnerable youth. PURPOSE • Extend research showing that that vulnerable adolescents who participated more than once a week in positive activities during their 11th grade year in high school were approximately twice as likely to graduate from high school and enroll in post-secondary education (Roeser & Peck, 2003) • …by examining both (a) a wider range of extracurricular activities and (b) how qualitatively distinct patterns of activity involvement relate to the educational resilience of vulnerable youth. • CONCLUSIONS • Vulnerable youths’ engagement in any one of four positive activity patterns resulted in a 3-fold increase in the chances of going on to college, independent of the effects of the total amount of time spent engaged in positive activities. • Some “more-than-once-a-week” activity patterns appear to promote unexpectedly positive educational pathways for vulnerable youth better than others. • These results argue against the development and implementation of a “one-size-fits-all” intervention strategy and for the development and implementation of specific intervention strategies for specific kinds of youth who live in specific kinds of social contexts. • ACKNOWLEDGEMENTS • This research was supported in part by a grant from the W. T. Grant Foundation awarded to Jacquelynne S. Eccles and Stephen C. Peck; a grant from the W. T. Grant Foundation awarded to Jacquelynne S. Eccles; and by NICHD Grant R01-HD33437 awarded to Jacquelynne S. Eccles and Arnold J. Sameroff. • We also thank Todd Bartko, Elaine Belansky, Heather Bouchey, Celina Chatman, Diane Early, Leslie Gutman, Kari Fraser, Katie Jodl, Ariel Kalil, Linda Kuhn, Sarah Lord, Karen Macarthy, Oksana Malanchuk, Alice Michael, Melanie Overby, Arnold Sameroff, Sherri Steele, Erika Taylor, Janice Templeton, Cynthia Winston, and Carol Wong. METHOD • Participants in this 4-wave longitudinal study were 49% female and 60% Black. • Wave 3; Age ~ 14; N = 1060 • Wave 4; Age ~ 17; N = 1057 • Wave 5; Age ~ 19; N = 912 • Wave 6; Age ~ 21; N = 887 • Median pretax family income in 1990 was $40,000-$45,500 for both Blacks and Whites