Download
1 / 26
260 likes | 438 Vues
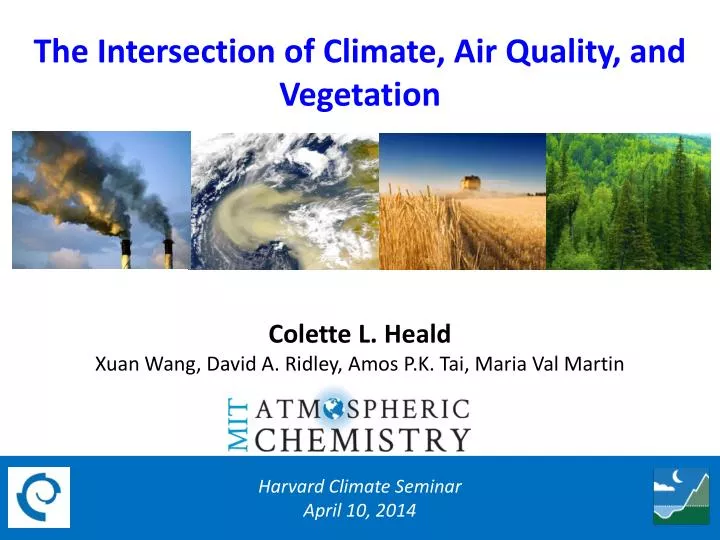
The Intersection of Climate, Air Quality, and Vegetation. Colette L. Heald Xuan Wang, David A. Ridley, Amos P.K. Tai, Maria Val Martin. Harvard Climate Seminar April 10, 2014. AIR QUALITY. Climate Feedbacks. Emissions, Removal. Altering

E N D
The Intersection of Climate, Air Quality, and Vegetation Colette L. Heald Xuan Wang, David A. Ridley, Amos P.K. Tai, Maria Val Martin Harvard Climate Seminar April 10, 2014
AIR QUALITY Climate Feedbacks Emissions, Removal Altering Ecosystem Health (Nutrients, Toxics) Climate Forcing Lots of interesting stuff I won’t talk about VEGETATION CLIMATE
Air Pollution is a Significant Public Health Concern(more premature deaths per year from PM than car accident fatalities in the US) 3.5M deaths/yr 3.1M deaths/yr [Lim et al., 2012] Particulate Matter (PM) is estimated to be the leading environmental cause of premature mortality. Overall , PM is the 3rd and 9th most deadly risk factor. Ozone is a risk factor for aging populations (i.e. Europe)
Ozone and PM Warm and Cool the ClimatePM is the Leading Source of Uncertainty in Global Climate Forcing [IPCC, 2013]
Ozone and PM also Alter Ecosystem Health CROP DAMAGE FERTILIZATION ACID RAIN Mahowald et al., (2011) suggests biogeochemical feedbacks from aerosols constitute a large climate cooling
AIR QUALITY Climate Feedbacks Emissions, Removal Dust Ozone Altering Ecosystem Health (Nutrients, Toxics) Crops Climate Forcing BC VEGETATION CLIMATE
IPCC AR5 Estimates that Black Carbon is the 2nd Largest Warming Agent in the Atmosphere. (but that’s not what models say) Absorption ↑ Lifetime ↓ How can these be reconciled? Aging Emission
Observations Suggest That Models Overestimate BC AeroCom means in black, HIPPO obs in colour Obs in black, AeroCom models in colour [Schwarz et al., 2010] [Koch et al., 2009] AeroCom models overestimate BC over Americas by factor ~8, overestimate remote HIPPO BC by factor ~5.
New Model Aging Processes for BC Hydro-philic Hydro-phobic 1.15 days Old Assumptions Sulfate, etc. Anthropogenic Hydro-philic Hydro-phobic k = 1/τ = a [SO2] [OH] + b New Assumptions Organic components Hydro-phobic Hydro-philic 4 hours (also increase fraction emitted as hydrophillic to 70%) Biomass burning (Moteki et al., 2007; Moffet et al., 2009; Friedman et al.,2009; Liu et al., 2010; Akage et al.,2012; Lack et al.,2012; Shamjad et al., 2012; Schwarz et al.,2008, Moteki et al., 2007; Moffet and Prather, 2009),
Impact of New Model Aging Processes on Simulation of BC HIPPO Continental (Near-Source) Good Better Still Bad Good simulation near source (with or without new aging). Modified aging scheme results in shorter lifetime and better simulation of low concentrations in remote locations. Vastly better than AeroCom. Generally within a factor of 2.
Considering Absorption Enhancement and Brown Carbon Anth BC Absorption enhancement from coating (AE=1.1) Smaller size, wider size range Absorption Coefficient Mie calculation BB BC Absorption enhancement from coating (AE=1.5) Larger size, narrower size range Absorption Coefficient Mie calculation Aromatic SOA Brown Carbon Get RI from field measurements Absorption Coefficient Mie calculation 50% of POA Biomass/biofuel Also “Most Absorbing” Simulation : Set AE=2 and standard aging mechanism (longer lifetime) (Akage et al., 2012; Schwarz et al., 2006; 2007; 2008; Lack et al., 2012; Dubovik et al., 2002; Shamjad et al., 2012; Moffet et al., 2009; Knox et al., 2009; Kondo et al., 2011; Lack et al., 2012; Moffet and Prather, 2009; Bond et al., 2006; Cappa et al., 2012)
Measurements Still Suggest Absorption is Underestimated *AAOD product here using lev2 SSA with lev1.5 AOD Better able to capture the spectral AAOD with our “best” simulation (including BrC), but still biased low (especially in biomass burning regions). Can “scale up” our model to match observations (Bond et al., 2013) – emissions or optics?
Our Work Suggests Smaller BC DRF Required to Match All Observational Constraints Brown Carbon contributes 35% of the warming from carbonaceous aerosols. BC DRF is less than methane and tropospheric ozone.Suggests that controlling BC is less effective for climate mitigation. [Wang, et al., in prep]
Dust From North Africa Air Quality (local & Americas) Ocean Fertilization (C cycle) Nutrient Supply (terrestrial productivity) Tropical Cyclone Genesis Summer dust conc. Relationship is breaking down? North African Dust Driven by Sahelian Precipitation Previous year’s Precip. Index Dust @ Barbados Negative Sahel Precip Anomaly [Mahowald et al., 2009] [Prospero and Lamb, 2003] Observations from Barbados suggest that increasing trend in dust from 1960s to 1980s may have reversed. Impact of greening of the Sahel on productivity of the Amazon?
Why is Dust From North Africa Decreasing? African dust has been decreasing year-round at both source and down-wind by ~10%/decade from 1982-2008, with substantial interannual variability. Model captures this! Use model to assess that trends & variability largely from surface winds NOT vegetation changes. Fixed meteorology Fixed vegetation Fixed surface winds
Vegetation Changes Are NOT Responsible for the Recent Trend in Dust From Africa (2002-2006) – (1982-1986) Vegetation (AVHRR NDVI) Regions of substantial dust decrease (black contours) Surface Winds (MERRA) [Ridley et al., ACPD, 2014]
Possible Mechanism: Aerosols Changing Aerosols (via Climate)? ↓ anthropogenic aerosols ↑ SST ↓surface winds ↓ dust emission Northward shift of ITCZ ↑precipitation ↑greening Sahel [Booth et al., 2012; Ackerley et al., 2011; Evan et al., 2009; Folland et al., 1986; Broccoli et al, 2006; Doherty et al., 2012] Suggests that this may be a short-term trend. Let’s wait and see!
Considering the Impact of Air Pollution and Climate on Global Food Security (in an era of rising food demand) AIR POLLUTION (Snap peas damage due to ozone exposure) CLIMATE (Illinois heat wave summer 2012) tolerant sensitive
Estimating the Climate and Air Quality Impacts on Global Crop Productivity From Historical Record [Mills et al. 2007] °C Tmax Thigh Relative Yield based on Butler and Huybers [2013] Tmean Wheat Ozone exposure (ppm-hour) Tbase Estimate yield-O3 relationship from literature estimate of O3 exposure indices Estimate yield-climate relationship from a MLR of 1961-2010 FAO crop yields and NCEP/NCAR reanalysis Day since 1 June
How Will Drivers Change in the Future? Community Earth System Model (CESM 1.1) Simulation 2000-2050 changes in maximum daily 8-h average (MDA8) O3 (ppbv) 2000-2050 changes in surface air temperature (K) stippling=significant Warming climate, similar in both scenarios. Ozone projections reflect regional pollution control, but RCP8.5 includes large increases in methane (increases O3 background)
Impacts of Climate Change and Ozone Pollution on Total Crop Production Pollution effect: +0.22 ×10¹⁵ kcal RCP4.5 Combined effect: -0.64 ×10¹⁵ kcal Climate effect: -0.80 ×10¹⁵ kcal -50 -20 -10 -5 -2 -1 0 1 2 5 10 20 50 106 kcal ha-1 Pollution effect: -0.26 ×10¹⁵ kcal RCP8.5 Combined effect: -1.07 ×10¹⁵ kcal Climate effect: -0.81 ×10¹⁵ kcal Future crop productivity very sensitive to ozone pollution & climate change. Uncertainty associated largely with future air quality.
Impact of Ozone Pollution and Climate Change on Crop Production Around the World The rate of undernourishment in developing countries in 2050 nearly doubles due to climate and ozone. [Tai, val Martin and Heald, submitted]
But Wait, There are Known Large Summertime Biases in the Simulation of Surface Ozone in Eastern US and Europe [Fiore et al., 2009] EMEP [Lamarque et al., 2012] [Lapina et al., 2014] [Murazaki and Hess , 2006]
The Importance of Getting Dry Deposition of Ozone Right CLM (and MOZART) dry deposition schemes fail to account for leaf area density in calculation of leaf cuticular resistance and stomatal resistance Correcting bugs in dry deposition parameterization in land model significantly reduces some the surface O3 bias…. So we thought about whether there might be other issues… [val Martin et al., GRL, in press]
How Vegetation Phenology Is Controlling Predictions of Surface O3 Harvard Forest Original Scheme Corrected Scheme Optimized Scheme Observations RMNP Observations (ppb) Reducing stomatal conductance drastically improves simulation of dry deposition velocity and surface concentrations of ozone. Realistic? Implications for carbon and hydrological cycle?
CONCLUSIONS AQ → climate: Warming from BC overestimated in AR5. Not as effective a mitigation strategy for climate change. AQ → climate → AQ: Recent decrease in North African dust due to stilling of winds (not vegetation), that we speculate is due to decreasing anthropogenic aerosols from the U.S. AQ + climate → vegetation: Together AQ & climate substantially threaten global food security Vegetation → AQ: Vegetation seasonality & density controls surface O3 in Eastern U.S. and Europe (and Amazon)