Download
1 / 37
370 likes | 489 Vues
Non-planet mechanisms for clearing and sculpting discs. James Owen (IOA -> CITA) Barbara Ercolano (IOA -> LMU). Hope to convince you:. (Xray) photoevaporation now well understood Significant factor in disc evolution (Probably) responsible for ultimate clear out of protoplanetary discs

E N D
Non-planet mechanisms for clearing and sculpting discs • James Owen (IOA -> CITA) • Barbara Ercolano (IOA -> LMU)
Hope to convince you: • (Xray) photoevaporation now well understood • Significant factor in disc evolution • (Probably) responsible for ultimate clear out of protoplanetary discs • En route, produces structures with properties overlapping those produced by planets
Are observed structures (gaps, holes) pure dust phenomena? • Sharp edge due to radiation pressure? • Sharp edge due to photophoresis (Krauss et al 2007)? Probably not…. See Dominik & Dullemond 2011 Hard to suppress small dust production
Do discs clear via viscous accretion? • UV excess => do accrete at rates ~ M_disc/age • Far too slow decline at late times…. (Lynden-Bell & Pringle 1974, Hartmann et al 1998) Phenomenological description as due to action of (pseudo) viscosity e.g for ~ R ( => get similarity solution: M = M_in ( 1 + t / t ) ~ 1/R ) -1.5 in
Need extra gas clearing mechanism To clear discs within ~ 5 Myr, to make observed hole/gap structures… • Planets ? • Photoevaporation ? • Clearing by MRI driven winds? Suzuki et al 2010: inner hole forms very early (0.1 A.U. @ 10^5 years, 1 A.U. @ 10^6 years) Halts accretion onto star from very early times also…. Actually destination of `wind’ unclear (doesn’t attain escape velocity….)
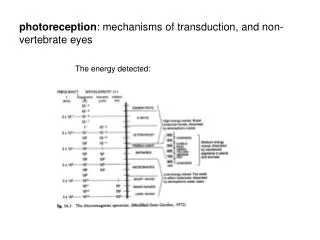
Key facts for understanding Xray photoevaporation • Temperature of Xray heated gas set by • In a Parker wind, sonic transition occurs at radius where max T is 1-2 x 10^ 4 K = isothermal , spherical
Results of radiation hydrodynamical modeling of Xray photoevaporation (Owen et al 2010, 2011b) T ~ 2000 K • R => T and (beyond 10 A.U.) fixes n and hence mass flux sonic surface where still holds approximately T ~ 10,000 K
Result: • Proportional to L_x • Independent of M_* • Doesn’t depend on properties of underlying disc!
Owen et al 2010 Discs with inner holes As vary R_hole , topology of innermost streamline and variation of c_s and u with scaled distance along streamline is invariant photoevaporation rate INDEPENDENT of inner hole size (~ 10^{-8} solar mass/yr for L_X - 10^30 erg/s) Owen et al 2011b)
What about other radiation sources? • EUV? Can’t penetrate Xray wind • FUV? Within 100 A.U. only heats below Xray sonic surface - doesn’t change mass loss rates Owen et al 2011 b) (But may affect structure of subsonic region: See Gorti & Hollenbach 2004,2008,2009) ALSO MAY BE IMPORTANT MASS LOSS MECHANISM AT > 100 A.U.
Combining photoevaporation with viscous evolution: Constant L_X Owen et al 2011a) I II 76 % total lifetime Initial 75% total lifetime Stage I 76% total lifetime 77% total lifetime 78 % total lifetime Stage III 79 % total lifetime Four stage evolution: Etc. Stage II I Viscous dominated II Draining inner hole III Outer disc clearing IV Thermal sweeping 80% Accreting, dust free (migration), <10 AU Empty inner hole, > 10 AU NEW
Stage IV: thermal sweeping • Once Xrays penetrate a radial distance ~ H into disc, heated gas evaporates vertically in `plume flow’ • Residual disc clears on ~ dynamical time of inner rim (~ 10s of A.U.) Sets in when column density at inner rim is ~ 0.5 g/cm^2 Remove few -> 10 Jupiter masses of gas
Thermal sweeping limits lifetime of non-accreting hole stage (stage III) • Fraction of lifetime spent with hole (stage II + III) ~ 10% • Fraction of lifetime spent with `transparent accreting’ hole (stage II) ~ 5% • Fraction of lifetime spent with non-accreting hole (stage III) ~ 5%
Which inner hole sources could be due to photoevaporation? Around half (those in shaded region) Owen et al 2011b) • Systems evolve as inner holes drain • Initial Mdot depends on L_X • Initial radius depends on M_* These can’t These are upper limits Cyan = Brown et al 09, blue = Cieza et al 10, Black open - Ercolano et al 09, Black filled = Espaillat et al 08,09, red= Kim et al 09, magenta - Merin et al 10, green = Najita et al 10
Xray:Ercolano & Owen 2010 EUV: Alexander 2008 Evidence for Xray photoevaporation Both Xray and EUV photoevaporation explain line profiles of NeII 12.8 m Only Xray photoevaporation explains low velocity (~ 5 km/s) component of OI 6300 in T Tauri stars (cf EUV models: Font et al 2004 ) Cf observed profiles for TW Hydra, Pascucci & Sterzik 2009 …….but note lack of blueshifted OI 6300 in TW Hyda ……Pascucci et al 2011
Evidence for Xray photoevaporation? • High L_X stars lose discs earlier - implies WTTs should have higher L_X on average. Well known observational correlation. Usually argued that Xrays suppressed/absorbed by accretion: perhaps instead accretion suppressed by Xrays……. Preibisch et al 2005, Greogory et al 2007 Population synthesis: Owen et al 2011a
A DISCRIMINANT FOR DISC CLEARING: PLANETS V. PHOTOEVAPORATION? Dependence on metallicity: Photoevaporation more efficient at low Z: lower dust extinction => Xrays heat to higher column EXPECT SHORTER DISC LIFETIMES AT LOW Z
Disc lifetime **increases*strongly with decreasing Z if it’s instead set by time required for planet formation • A possible observational discriminant? -5/2 Z (see Ercolano & Clarke 2009) -11/2 Z
Recent claim of shorter disc lifetimes in lower Z environment …further studies at low Z may hold the key to discriminating between photoevaporation and planet formation
CONCLUSIONS Xrays can drive photoevaporative winds of 10^-8 M_sun/yr at upper end of XLF: like EUV winds, these produce a RAPID clearing phase but the Xray wind cuts in at much higher accretion rate. Produce small holes at range of accretion rates but no accreting holes beyond ~ 20 A.U.; expect accreting and non-accreting holes to have similar frequency. Xray photoevaporation ==> line diagnostics ([Ne II] 12.8 m and [OI] 6300 lines ) Xray photoevaporation: shorter disc lifetimes at low Z (opposite to clearing by planet formation) Explaining higher L_x in general in discless stars (shorter lifetimes) Predicts shorter disc lifetimes at low Z (opposite to planets!)
Pre-main sequence stars in the Xray Preibisch et al 2005 • Properties well characterised • Correlation with stellar mass (but broad spread at given mass) • NOT CAUSED BY ACCRETION (some anti-correlation between L_X and strength of disc diagnostics) • Previous studies of Xray-disc interaction focused on non-thermal ionisation by hard Xrays (=> implications for MRI) See also Albacete-Colombo et al 2007 Neuhauser et al 1995, Flaccomio et al 2003
Synthetic X-EUV spectrum of T Tauri star From Ercolano et al 2009a Generated by plasma code of Kashyap & Drake 2000 from Chandra Xray emission measures of T Tauri stars by Maggio et al 2007 and a low T (~ 10^4 K) component based on emission measures of RS CVn binaries (Sanz Forcada et al 2002) EUV = 10^41 /s (cf Alexander et al 2005) L_X= 2 x 10^{30} erg/s
Coronal emission doesn’t necessarily reach disc • Effect on spectrum of different screening columns close to star EUV screened out by N_H =10^20/cm^2 Xrays penetrate to N_H = 10^22/cm^2
HOW TO SIMULATE HYDRODYNAMICALLY: Use strong correlation between T in X ray heated gas and ionisation parameter = F_X/n (defined locally)
ZEUS 2D SIMULATION: T IN XRAY HEATED REGION SET BY Owen, Ercolano, Clarke & Alexander 2009 Mass loss rate = 1.5 x 10^{-8} M_/yr
Base of Xray heated region Xray heated region ~few 1000 K Gas T set by dust T Use MOCASSIN on converged flow structure to check temperature parametrisation
WHEN COMBINE EITHER EUV OR X-EUV WIND PROFILES WITH VISCOUS EVOLUTION 3 stage evolution: Normal viscous evolution Creation of inner hole Evaporation of outer disc
Similarities between EUV & X-EUV models 3 stage evolution Gap opens at few A.U. Inner hole and outer disc clearing are both fast cf first (viscous) stage Differences: • Gap opens at much higher accretion rate in X-EUV case: • Higher accretion rate on star during inner hole draining • 10 x higher outer disc mass when gap opens
Observational diagnostics of X-EUV photoevaporation Ercolano & Owen 2010 Also agrees with lack of observed blueshift in inner hole source GM Aur (optically thin so line symmetric)
Are observed inner holes due to photoevaporation?Can explain many inner hole sources but not very large holes with high accretion rate Tracks produced by models with different L_X_ Owen et al in prep. Herschel and ALMA will improve statistics
Correlation between accretion rate and L_X in T Tauri stars Broad spread in L_X at given mass (Preibisch et al 2005): Red = no wind Black = wind for L_X =2 .10^30 Blue = low L_X (wind x 0.1) Note phase of photoevaporation starved accretion prior to rapid Decline : see Drake et al 2009
L_X cf average for stars of that mass The observational situation
But not always….. IRS 48 (Geers et al 2007) No clue from SED Inner hole in image
Evidence for photoevaporation: • Best evidence to date from line profiles of [Ne II] 12.8 micron emission - suggests outflow at ~ 10 km/s (=> ionised gas) Alexander 2008
Resulting Xray mass loss rates10 x higher than EUV Mass loss peaks at around 10-20 A.U. (cf EUV, peaks here)