Download
1 / 18
210 likes | 338 Vues
Standard Normal Distribution. Density Curve. A smooth curve that describes the overall pattern of the distribution The total area under the curve = 1 The curve will never go below the x-axis

E N D
Density Curve A smooth curve that describes the overall pattern of the distribution • The total area under the curve = 1 • The curve will never go below the x-axis • The area between two values is equal to the probability that the event will occur between those values
Uniform Distribution A continuous random variable has uniform distribution if its values are spread evenly over the range of possibilities. The graph of a uniform distribution results in a rectangular shape.
Uniform Distribution Kim has an interview right after class. If the class runs longer than 51.5 minutes, she will be late. Given the previous uniform distribution, find the probability that a randomly selected class will last longer than 51.5 minutes. There is a 25% Chance the class will last longer than 51.5 minutes.
Uniform Distribution Find the probability that a time greater than 50.5 minutes is selected.
Uniform Distribution Find the probability that a time between 51.5 minutes and 51.6 minutes is selected.
If a continuous random variable has a distribution with a graph that is symmetric and bell-shaped , as below, and it can be described by the following formula , then we say it has a normal distribution.
The standard normal distribution is a normal probability distribution with The total area under its density curve is equal to 1.
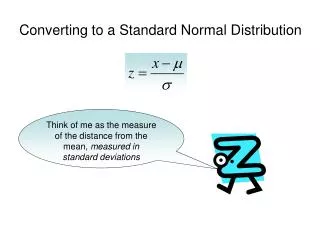
The standard normal distribution is a normal probability distributions with The total area under its density curve is equal to 1. All x-values are z-scores. A z-score refers to how many standard deviations above or below the mean a particular value is. The area under the curve is equal to its probability • Use Table A-2 (back cover of text) This table gives the area underneath the curve to the left of the z-score. • Use Ti-83/84 [2nd][Vars] [2: normal cdf(] enter two z scores separate by a comma.
The precision Scientific Instrument company manufactures thermometers that are suppose to give readings of 0° at the freezing point of water. Tests on a large sample reveal that at the freezing point of water the readings of the thermometers are normally distributed with a mean of 0° and a standard deviation of 1.00°C. A thermometer is randomly selected. Find the probability of getting a reading less than 1.75.
Assume that the readings on the thermometers are normally distributed with a mean of 0° and a standard deviation of 1.00°C. A thermometer is randomly selected. Find the probability of getting a reading greater than 1.96
Assume that the readings on the thermometers are normally distributed with a mean of 0° and a standard deviation of 1.00°C. A thermometer is randomly selected. Find the probability of getting a reading less than .
Assume that the readings on the thermometers are normally distributed with a mean of 0° and a standard deviation of 1.00°C. A thermometer is randomly selected. Find the probability of getting a reading between and .
Find the indicated area under the curve of the standard normal distribution. About ____% of the area is between z = -2 and z = 2 (or within 2 standard deviations of the mean)
Finding z scores from Known Areas • Draw a bell-shaped curve and identify the region under the curve that corresponds to the given probability. If that region is not a cumulative from the left, work instead with a know region that is cumulative from the left. • Using the cumulative area from the left, • locate the closest probability using table A-2. • To find a z score corresponding using Ti-83/84 [2nd ][Vars][invNorm.] enter area cumulative from the left.
Assume that the readings on the thermometers are normally distributed with a mean of 0° Find the temperature corresponding to the 95th percentile. That is find the temperature separating the top 5% from the bottom 95%.
Assume that the readings on the thermometers are normally distributed with a mean of 0° Find the temperatures separating the bottom 2.5% and the top 2.5%.
Homework! • 6.1 : 6- 39 eoo, 41- 49 odd.