Download
1 / 1
10 likes | 133 Vues
Using Value Images to Adjust Intensity in 3D Renderings and Photographs Reynold J. Bailey, Cindy M. Grimm. Goal. Exposition. Exposition (cont’d). Input: Original intensity image . Target intensity image (i.e. a value sketch). Pre-processing:

E N D
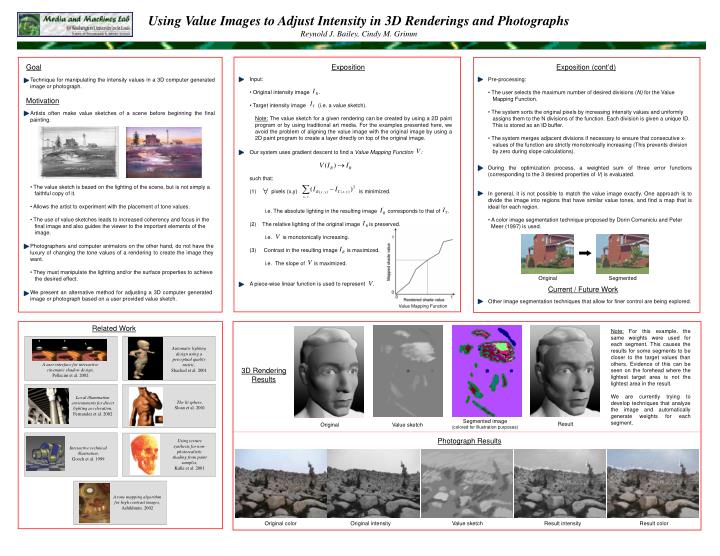
Using Value Images to Adjust Intensity in 3D Renderings and Photographs Reynold J. Bailey, Cindy M. Grimm Goal Exposition Exposition (cont’d) Input: • Original intensity image . • Target intensity image (i.e. a value sketch). Pre-processing: • The user selects the maximum number of desired divisions (N) for the Value • Mapping Function. • The system sorts the original pixels by increasing intensity values and uniformly • assigns them to the N divisions of the function. Each division is given a unique ID. • This is stored as an ID buffer. • The system merges adjacent divisions if necessary to ensure that consecutive x- • values of the function are strictly monotonically increasing (This prevents division • by zero during slope calculations). Technique for manipulating the intensity values in a 3D computer generated image or photograph. Motivation Artists often make value sketches of a scene before beginning the final painting. Note: The value sketch for a given rendering can be created by using a 2D paint program or by using traditional art media. For the examples presented here, we avoid the problem of aligning the value image with the original image by using a 2D paint program to create a layer directly on top of the original image. Our system uses gradient descent to find a Value Mapping Function : such that: pixels (x,y) is minimized. i.e. The absolute lighting in the resulting image corresponds to that of . The relative lighting of the original image is preserved. i.e. is monotonically increasing. Contrast in the resulting image is maximized. i.e. The slope of is maximized. During the optimization process, a weighted sum of three error functions (corresponding to the 3 desired properties of V) is evaluated. • The value sketch is based on the lighting of the scene, but is not simply a • faithful copy of it. • Allows the artist to experiment with the placement of tone values. • The use of value sketches leads to increased coherency and focus in the • final image and also guides the viewer to the important elements of the • image. In general, it is not possible to match the value image exactly. One approach is to divide the image into regions that have similar value tones, and find a map that is ideal for each region. • A color image segmentation technique proposed by Dorin Comaniciu and Peter • Meer (1997) is used. Photographers and computer animators on the other hand, do not have the luxury of changing the tone values of a rendering to create the image they want. • They must manipulate the lighting and/or the surface properties to achieve • the desired effect. Original Segmented A piece-wise linear function is used to represent . Current / Future Work We present an alternative method for adjusting a 3D computer generated image or photograph based on a user provided value sketch. Other image segmentation techniques that allow for finer control are being explored. Value Mapping Function Related Work Note: For this example, the same weights were used for each segment. This causes the results for some segments to be closer to the target values than others. Evidence of this can be seen on the forehead where the lightest target area is not the lightest area in the result. We are currently trying to develop techniques that analyze the image and automatically generate weights for each segment. Automatic lighting design using a perceptual quality metric, Shacked et al. 2001 A user interface for interactive cinematic shadow design, Pellacini et al. 2002 3D Rendering Results Local illumination environments for direct lighting acceleration, Fernandez et al. 2002 The lit sphere, Sloan et al. 2001 Segmented image (colored for illustration purposes) Result Original Value sketch Photograph Results Using texture synthesis for non-photorealistic shading from paint samples, Kulla et al. 2001 Interactive technical illustration, Gooch et al. 1999 A tone mapping algorithm for high contrast images, Ashikhmin. 2002 Original color Original intensity Value sketch Result intensity Result color