Download
1 / 25
250 likes | 383 Vues
Regional report on ozone research and monitoring Nordic countries Leif Backman (FMI) Finland Weine Josefsson (SMHI) Sweden Niels Larsen (DMI) Denmark and Greenland Árni Sigurðsson ( Vedurstofa ) Iceland Tove Svendby (NILU) Norway. Nordic sites of UV and total ozone. . . . . O. O.

E N D
Regional report on ozone research and monitoring Nordic countriesLeif Backman (FMI) FinlandWeine Josefsson (SMHI) SwedenNiels Larsen (DMI) Denmark and GreenlandÁrni Sigurðsson (Vedurstofa) IcelandTove Svendby (NILU) Norway
Nordic sites ofUV and total ozone . . . . O O . . . . . . . . O . . . O . O O . O O O O O O O O
Greenland Denmark DMI Brewer measurements No significant trends since 1991.
Danish ozone and UV activities Copenhagen: Brewersince 1992, broad band UV since 1993 Kangerlussuaq (NDACC): Brewersince 1990 Thule (NDACC): SAOZ since 1990, campaignbased O3 soundings Scoresbysund (NDACC):Wekly O3 soundingssince 1993, narrow band UV since 2008 Match campaigns Data reporting to NDACC and WOUDC UV index forecasts to the public in Denmark and Greenland NRT global UV (O3M-SAF) EC Earth climate model, stratosphericrepresentation, strat/trop coupling Modelling on personal UV exposure
Ozone and UV activities in Finland • Long-term monitoring • UV & TOZ (Sodankylä & Jokioinen) • Soundings • Sodankylä (GRUAN) soundings O3 (+ water vapour + PSCs) • Marambio soundings in cooperation with Argentina • Recent activity, participation on the development of the Air core instrument, GHG profile measurements (DB circulation) • Satellites • Networks • IGACO • EUMETSAT O3SAF • Services & data dissemination to the public • UVI forecast • OMI VFD • Examples of analysis & combining data • 2011 ozone loss and effect on summer UV • Ozone trends from satellite data
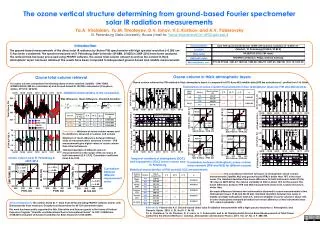
Combined SAGE II–GOMOS ozone profile data set for 1984–2011 and trend analysis of the vertical distribution of ozone • Data from two satellite occultation instruments were combined to generate a homogeneous ozone time series for 1984-2011 (60S-60N) • SAGE II solar occultation instrument,1984-2005 • GOMOS star occultation instrument, 2002-2012. • At altitudes from 35 km to 50 km a small positive trend of 0-2% per decade was found • Kyrölä et al., ACP, 2013.
Ozone and UV activities in Sweden • Long-term monitoring • Norrköping and Vindeln (Total ozone and UV) • Kiruna (Lidar, FTIR, DOAS) • Harestua (NDACC, FTIR) in Norway • Satellites (mainly SMR and OSIRIS on ODIN) • Dissemination to the public • UVI forecast • Near real time UV (STRÅNG-system) • SMHI, Swedish Environmental Protection Agency and Swedish Radiation Safety Authority have info on ozone and UV on their web sites.
The Norwegian Radiation Protection Authority NILU - Norwegian Institute for Air Research University of Oslo Andøya Rocket Range Main institutions involved in the Norwegian UV and ozone monitoring activities Additional research activities at CICERO, NTNU, University of Bergen, The Bjerknes Centre and The Polar Institute
UV and ozone monitoring stations in Norway Ny-Ålesund (Svalbard) • A Andøya ALOMAR (Andøya) Ny-Ålesund UV Univ. of Oslo Total ozone Ozoneprofiles (nowexcluded) Oslo
UV-trend • Annual integrated UV doses (kJ/m2) for the period 1995-2013 in: Oslo Tromsø/AndøyaNy-Ålesund • No significant trend • Below Norrköping (Sweden) • Significant trend
CFC measurements at Zeppelin, SvalbardPerformed by NILU • A new Medusa-GCMS installed in 2010: • 40new species measured • Improved precision compared to ADS-GCMS Annual means of observed CFCs at Zeppelin 2001-2011. Upper left panel: CFC-11, upper right panel: CFC-12, lower left panel: CFC-113, lower right panel: CFC-115
Future plans, needs and recommendationsPlease read the National reports of each countrythe end
Future plans, needs and recommendations Funding for monitoringsecuredonly to the end of year 2015 Furtherdevelopments of the EC-Earth model, role of stratosphericchanges on troposphericclimate, large scalecirculation modes, attribution studies Maintaining and running stratospheric monitoring stations in the Arctic and elsewhere is becoming an increasingly heavy burden on national funding sources and possibilities for direct funding of ground-based monitoring activities and data provision should be considered to be included in major international programmes such as the European Copernicus og ESA programmes at stations within well established networks such as NDACC.
Needs and Recommendations Ozone and UV monitoring has a fairly weak financial basis in Norway Predictable multi-annual funding schedules should be established in order to free operations from additional funding pathways, e.g. satellite validation projects and short-time research projects. National funding for ozone and UV monitoring in Denmark and Greenland is secured until the end of 2015. After this period the funding situation will be renegotiated. Research efforts will be directed towards improved understanding of the role of stratospheric changes for tropospheric climate including the dynamical coupling between the troposphere and the stratosphere. It is intended to include a stratospheric representation in new developments of the ECEarth model complex. National funding for ozone and UV monitoring in Sweden is questioned every second year. Other activities rely on research grants i.e. short-term.
Observations • Results • Theorymodelling and otherresults • Dissemination • Future • Recommendations
Ozone trends Ny-Ålesund (79ºN,12ºE) Tromsø/Andøya (69ºN,16ºE) Oslo (60ºN,10ºE)
Atmosphericmeasurementscont. • Harestua Chalmers UnivofTechn. Solar FTIR atmospheric columns, and partial columns of up to 25 atmospheric species can be retrieved with good accuracy. This includes stratospheric ozone, reservoir species (HCl, ClONO2, HF, HNO3) and climate gases (CH4, N2O) and species of relevance to atmospheric chemistry (CO and ethane). The data are stored at the NDACC data base. • Kiruna Since 1996 the Karlsruhe Institute of Technology (KIT) operates a FTIR (Fourier-Transform Infrared Spectrometer. The KIT owned millimeter wave radiometer MIRA2 is operated at RF since November 2012, aiming for long-term observation of ozone and possibly other trace gases. There is also a DOAS-instrument from University of Heidelberg recording primarily the total column density of NO2,.
Services & data dissemination to the public • UV-index forecast http://en.ilmatieteenlaitos.fi/uv-index Finnish observations from 6 sites and global UVI forecast. • OMI very fast delivery http://omivfd.fmi.fi/o3.html The measurements are from OMI (Ozone Monitoring Instrument) onboard the EOS-Aura satellite and the images come available around 15 min after the satellite overpass.
Satellite • Satellites • FMI has a strong participation in several satellite instruments that are targeted for monitoring ozone in the atmosphere (GOMOS/Envisat, OSIRIS/Odin, OMI/EOS-Aura, GOME-2/METOP-A, METOP-B). • Chalmers tech univ is involved in Odin satellite • Networks • FMI coordinates the EUMETSAT O3SAF (satellite application facility for atmospheric composition and UV radiation) http://o3msaf.fmi.fi/index.html • FMI hosts the IGACO ozone secretariat, http://www.igaco-o3.fi
Activities associated with the 8th ORM recommendations • Continued focus on the existing ozone and UV monitoring activities; ensure high quality data series. Report data to NDACC and WOUDC • Studies of chemical and dynamical processes responsible for ozone production and loss, e.g.: • Studies of the low Arctic ozone of spring 2011 (Balis et al., 2011; Isaksen et al., 2012) and the corresponding increase in UV (Bernhard et al., 2013). • Impact of future aircraft emissions on atmospheric chemistry (Hodnebrog, 2012) • Solar impact on the chemistry of the middle atmosphere through energetic particle precipitation (Kvissel et al., 2012). • Continued focus on ground‑based observations of ODS, their substitutes and greenhouse gases at Zeppelin (Svalbard). • Studies on halocarbons and related compounds: Review of GWP and Radiative Efficiencies (Hodnebrog et al., 2013) • GB measurements of solar UV radiation in developed countries with high UV levels, e.g. the Tibetan Plateau (Norsang et al., 2014)
National ozone and UV programme • NILU responsible for the programme ”Monitoring of the atmospheric ozone layer and natural ultraviolet radiation” • Funded by the Norwegian Environment Agency • Programme established in 1990. UV included in the programme in 1995 • Annual report: status of the ozone layer, trend results, ozone/climate interaction, etc.