Download
1 / 4
40 likes | 224 Vues
Progress of WASH-in-Schools in Chhattisgarh 2013 A perspective of status of drinking water and sanitation in schools in Chhattisgarh. unite for children. Drinking water and toilet facility in schools in Chhattisgarh. Total no. of schools (Trend). Distribution of schools by category, 2011-12.

E N D
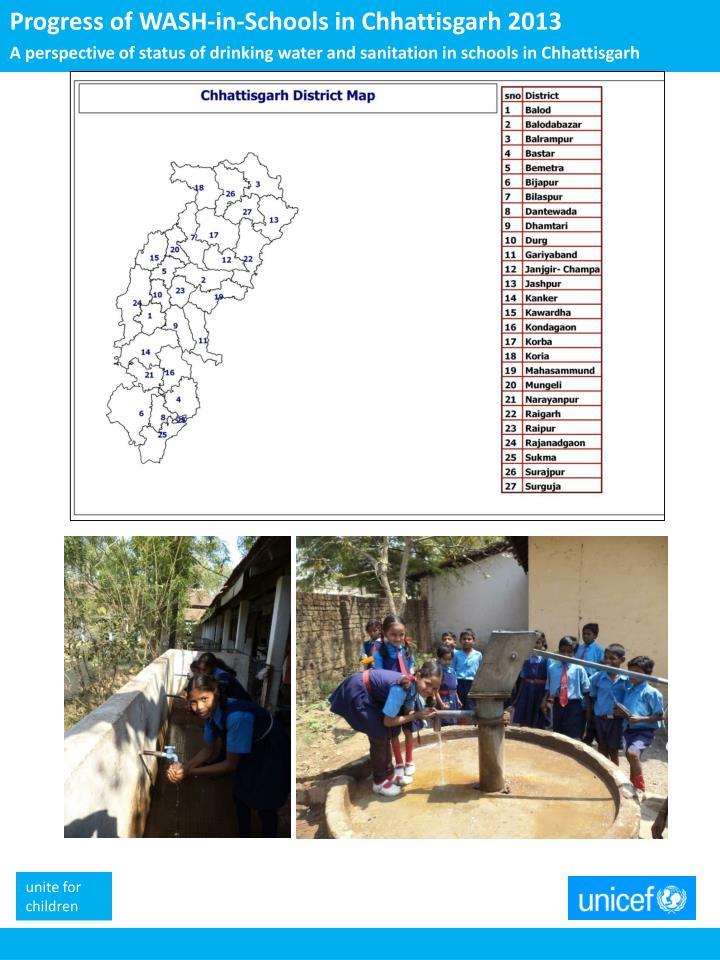
Progress of WASH-in-Schools in Chhattisgarh 2013 A perspective of status of drinking water and sanitation in schools in Chhattisgarh unite for children
Drinking water and toilet facility in schools in Chhattisgarh Total no. of schools (Trend) Distribution of schools by category, 2011-12 • There has been nominal (around 2.7 %) increase in number of schools till 2011-12 as against number of schools in 2005-06. • Primary only (67%) & Upper Primary only (27%) schools alone account for ~94% of the elementary schools in the state. • [Source: State Report Cards, District Report Cards, DISE 2011-12, NUEPA, New Delhi] Trend of drinking water facility in schools • Coverage of drinking water facility in schools has shown an increase from ~84% in 2005-06 to 94% in 2011-12. • From 2005-06, an additional 6,258 schools have been covered with drinking water supply facility till 2011-12. • [Source: State Report Cards, District Report Cards, DISE 2011-12, NUEPA, New Delhi] Trend of toilets in schools • Coverage of common toilet facility in schools increased from 17% (2005-06) to 44% (2008-09), but again decreased to 25% (2010-11), which may be attributed to provision of separate toilets for boys & girls. Data on common toilet availability in schools under DISE 2011-12, not published so far. • Coverage of separate girls toilets has shown a considerable increase from mere 10% in 2005-06 to 58% in 2011-12 with 25,312 additional schools having separate toilets for girls. • [Source : State Report Cards, District Report Cards, DISE 2011-12, NUEPA, New Delhi]
The functionality gap Coverage Vs Functionality of drinking water and toilets in schools 2011-12 • Nearly 93% of total schools have drinking water facility. However, out of the total schools with drinking water facility (i.e. 93%), only 92% (based on raw data from MIS, SSA) are have functional drinking water facility . • Nearly 58% of schools have girl’s toilet facility. Out of these schools with girl’s toilet facility (i.e. 58%)- only 73% of the school have functional girl’s toilets. • Nearly 54% of schools have boy’s toilet facility. Out of these schools with boy’s toilet facility (i.e. 54%)- only 69% of the school have functional boy’s toilets. • [Source: Flash Statistics, State Report Cards, DISE 2011-12, NUEPA, New Delhi & Raw data (DISE 2011-12) from MIS Cell (SSA), Raipur ] Functionality of WASH facilities in schools across districts, 2011-12 • Ten districts namely Balrampur, Bastar, Raigarh, Kondagaon, Bilaspur, Rajnandgaon, J. Champa, Surajpur, Bijapur and Jashpur account for more than 50% of schools without drinking water facilities. Eight districts namely Korba, Raigarh, Kanker, JashpurmSurajpur, Bastar, Bilaspur & Kondagaon account for more than 50% of the non functional drinking water in the State. • Ten districts namely Raigarh, Rajnandgaon, Kanker, BlodaBazar, Surajpur, Gariyaband, Bastar, Surguja, JanjgirChampa and Kawrdhaaccount for more than 50% of schools without toilet – Girl’s facility. Seven districts namely Korba, Koria, Balrampur, Bilaspur, Kondagaon, Raipur, Mahasamund account for more than 50% of the non functional girl’s toilets in the State. • Ten districts namely Raigarh, Surajpur, Bilaspur, BalodaBazar, Suguja, Balrampur, Kanker, JanjgirChampa, Bastar and Raipur account for more than 50% of schools without toilet – boy’s facility. Seven districts namely Korba, Koria, Kondagaon, Gariyaband, Bemetara, Raipur, Mahasamund account for more than 50% of the non functional boy’s toilets in the State. • [Source: DISE 2011-12, Raw Data, SSA MIS, Raipur] Independent assessment of WASH facilities in schools shows a similar trend in functionality • 90% schools have drinking water facility, while it is functional in 79% of schools (as against total no. of schools). • Nearly 84% of schools have toilet facility of which merely ~51% of the schools have functional toilets. • Despite the coverage of ~65% schools with separate toilets for girls’, merely ~42% of schools have functional girls’ toilets. • [Source: ASER 2012 report]
WASH-in-Schools: Acceleration required Separate toilets for girls is still a long way to go… Urgent need to reach to all schools on priority basis • Chhattisgarh has 6% schools without drinking water facility, 42% schools without any girl’s toilets facility and 46% schools without any boy’s toilets facility . • 4 districts namely Balrampur, Bastar, Raigarh, Kondagaon alone account for more than 25% of schools (1,332) without drinking water facilities. • 4 districts namely Raigarh, Rajnandgaon, Kanker & BalodaBazar account for more than 25% (6,469) schools without separate toilets for girls. • 5 districts namely Raigarh, Surajpur, Bilaspur, BalodaBazar & Surgujaaccount for more than 25% of schools (8,290) without separate toilets for boys. • [Source: State Report Cards (DISE 2011-12) & Raw Data, SSA MIS (DISE 2011-12), Raipur] • Disclaimer: • The WASH status report is based on the following key documents: • State Report Cards (SRCs), NUEPA, New Delhi (Both report and database sheet) • District Report Cards (SRCs), NUEPA, New Delhi(Both report and database sheet) • Flash Statistics, NUEPA, New Delhi • Raw Data, SSA, MIS (DISE-2011-12), Raipur • ASER, 2012 • As the latest data available used for the report is of DISE 2011-12, so the status given in the reports represents the status as on September 30, 2011. April 2013