Download
1 / 20
241 likes | 743 Vues
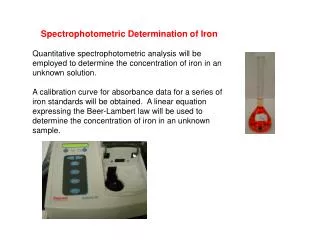
Spectrophotometric Analysis. Spectrophotometric techniques are used to measure the concentration of solutes in solution by measuring the amount of light that is absorbed by the solution in a cuvette placed in the spectrophotometer.

E N D
Spectrophotometric Analysis Spectrophotometric techniques are used to measure the concentration of solutes in solution by measuring the amount of light that is absorbed by the solution in a cuvette placed in the spectrophotometer. The spectrophotometer can measure the amount of light or electromagnetic radiation (of certain frequency) transmitted or absored by the solution.
5-1 Absorption of Radiant Energy Wave-particle Nature of Radiant energy: Light and other forms of radiant energy have a dual nature (wave and particle) Electromagnetic radiation is a type of energy that is transmitted through space as a transverse wave at enormous velocity. It takes numerous forms known as electromagnetic spectrum. The electromagnetic spectrum include gamma ray, X-ray, ultraviolet (UV), visible, infrared (IR), microwave and radio-wave radiation.
Wave motion of light 1- Wave Properties The wave is described either in terms of its wavelength (l),the distance between successive maxima or minima of a wav(nm), or in terms of the frequency(n), the number of oscillation of the field per second. The velocity of light, c, is given by the equation: C= n l
2- particle properties Electromagnetic radiation of light can be viewed as a stream of discrete wave packets of distinct particles called photons. The energy E of photon depends upon the frequency of the radiation E = hn Therefore: h = Planck’s constant (6.626 x 10⁻³⁴ J s) n = frequency of the radiation (most common units = cm-1 Energy is inversely proportional to wavelength
The electromagnetic spectrum The ultraviolet region extends from about 10 to 380 nm The most analytically useful region is from 200 to 380 nm, called the near- ultraviolet region or quartz UV region. The visible (VIS) region extends from about 380 to 780nm. The infrared (IR) region extends from about 0.78μm to 300 μm. The near-infrared (IR) region extends from about 0.80μm to 2.5 μm. The far-infrared (IR) region extends from about 2.5μm to 16 μm.
Regions of Electromagnetic Spectrum-the “colour” of light Fig. 1
The absorption processHow does matter absorb radiation When polychromatic light (white light), which contains the whole spectrum of wavelengths in visible region, is passed though an object will absorb certain of the wavelengths, leaving the unabsorbed wavelengths to be transmitted. These residual transmitted wavelengths will be seen as a color. This color is complementary to the absorbed colors.
Absorptionis a process in which chemical species (atom, ion or molecule) in a transparent medium selectively attenuate certain frequencies of EMR. Absorption spectrum is a plot of the amount of light absorbed by a sample as a function of wavelength. At room temperature most substance are in their lowest energy or ground state. When an atom, molecule or ion absorbs EMR it is promoted to higher energy states or excited states. The excited state is a transition one and the species soon looses the energy it gained and returns to its ground state by relaxation process either as heat of collision or sometimes emits radiation of specific wavelength.
Second Excitation state E2 hv2 E1 First Excitation state hv1 E0 Ground state
When a molecule interacts with photons of UV or VIS radiation excitation of electrons takes place to higher electronic energy level at any of its vibrational level. Eex-Eg=hnof the photon absorbed. UV / VIS radiation cause electronic transition which is accompanied by vibrational and rotational. If the compound subjected to IR radiation vibrational and rotational transitions in ground state occure. Rotational transitions alone can be brought about by microwave.
Ultraviolt and visible radiations have sufficient energy to cause trnsitions of the outermost or valence electrons. If large amount of energy is absorbed by certain substance, bonds may be ruptured and new compounds are formed photolysis. This may occur upon absorption of far Ultraviolt as its energy is sufficiently high to exceed the energy of formation of certain bonds. The total energy of a molecule is given by Etotal=Eelectronic+Evibrational +Erotational
Beer’s Law cuvette slit source detector P P0
ε : is molar absorptivity and it is unique for a given compound ( L.mol-1. cm-1) b : is path length (cm) c : concentration (M) A = -logT = log(P0/P) = εbc T = P/P0 Compound x has a unique εat different wavelengths Works for monochromatic light %T= 100xT
Instruments for measuring the absorption of U.V. or visible radiation are made up of the following components; Instruments Sources (UV and visible) Wavelength selector (monochromator) A Sample cellDetector A device to read out the response of the detector schematic diagram of a single-beam UV-Vis. spectrophotometer
(Abs) (Abs) Linear curve relationship Exponential curve relationship
Calibration Curve • - Linear calibration curves • - non linear calibration curves • Linear Calibration curve of Beers law
Deviations from Beers law • 1- at high concentrations • 2- at low concentrations